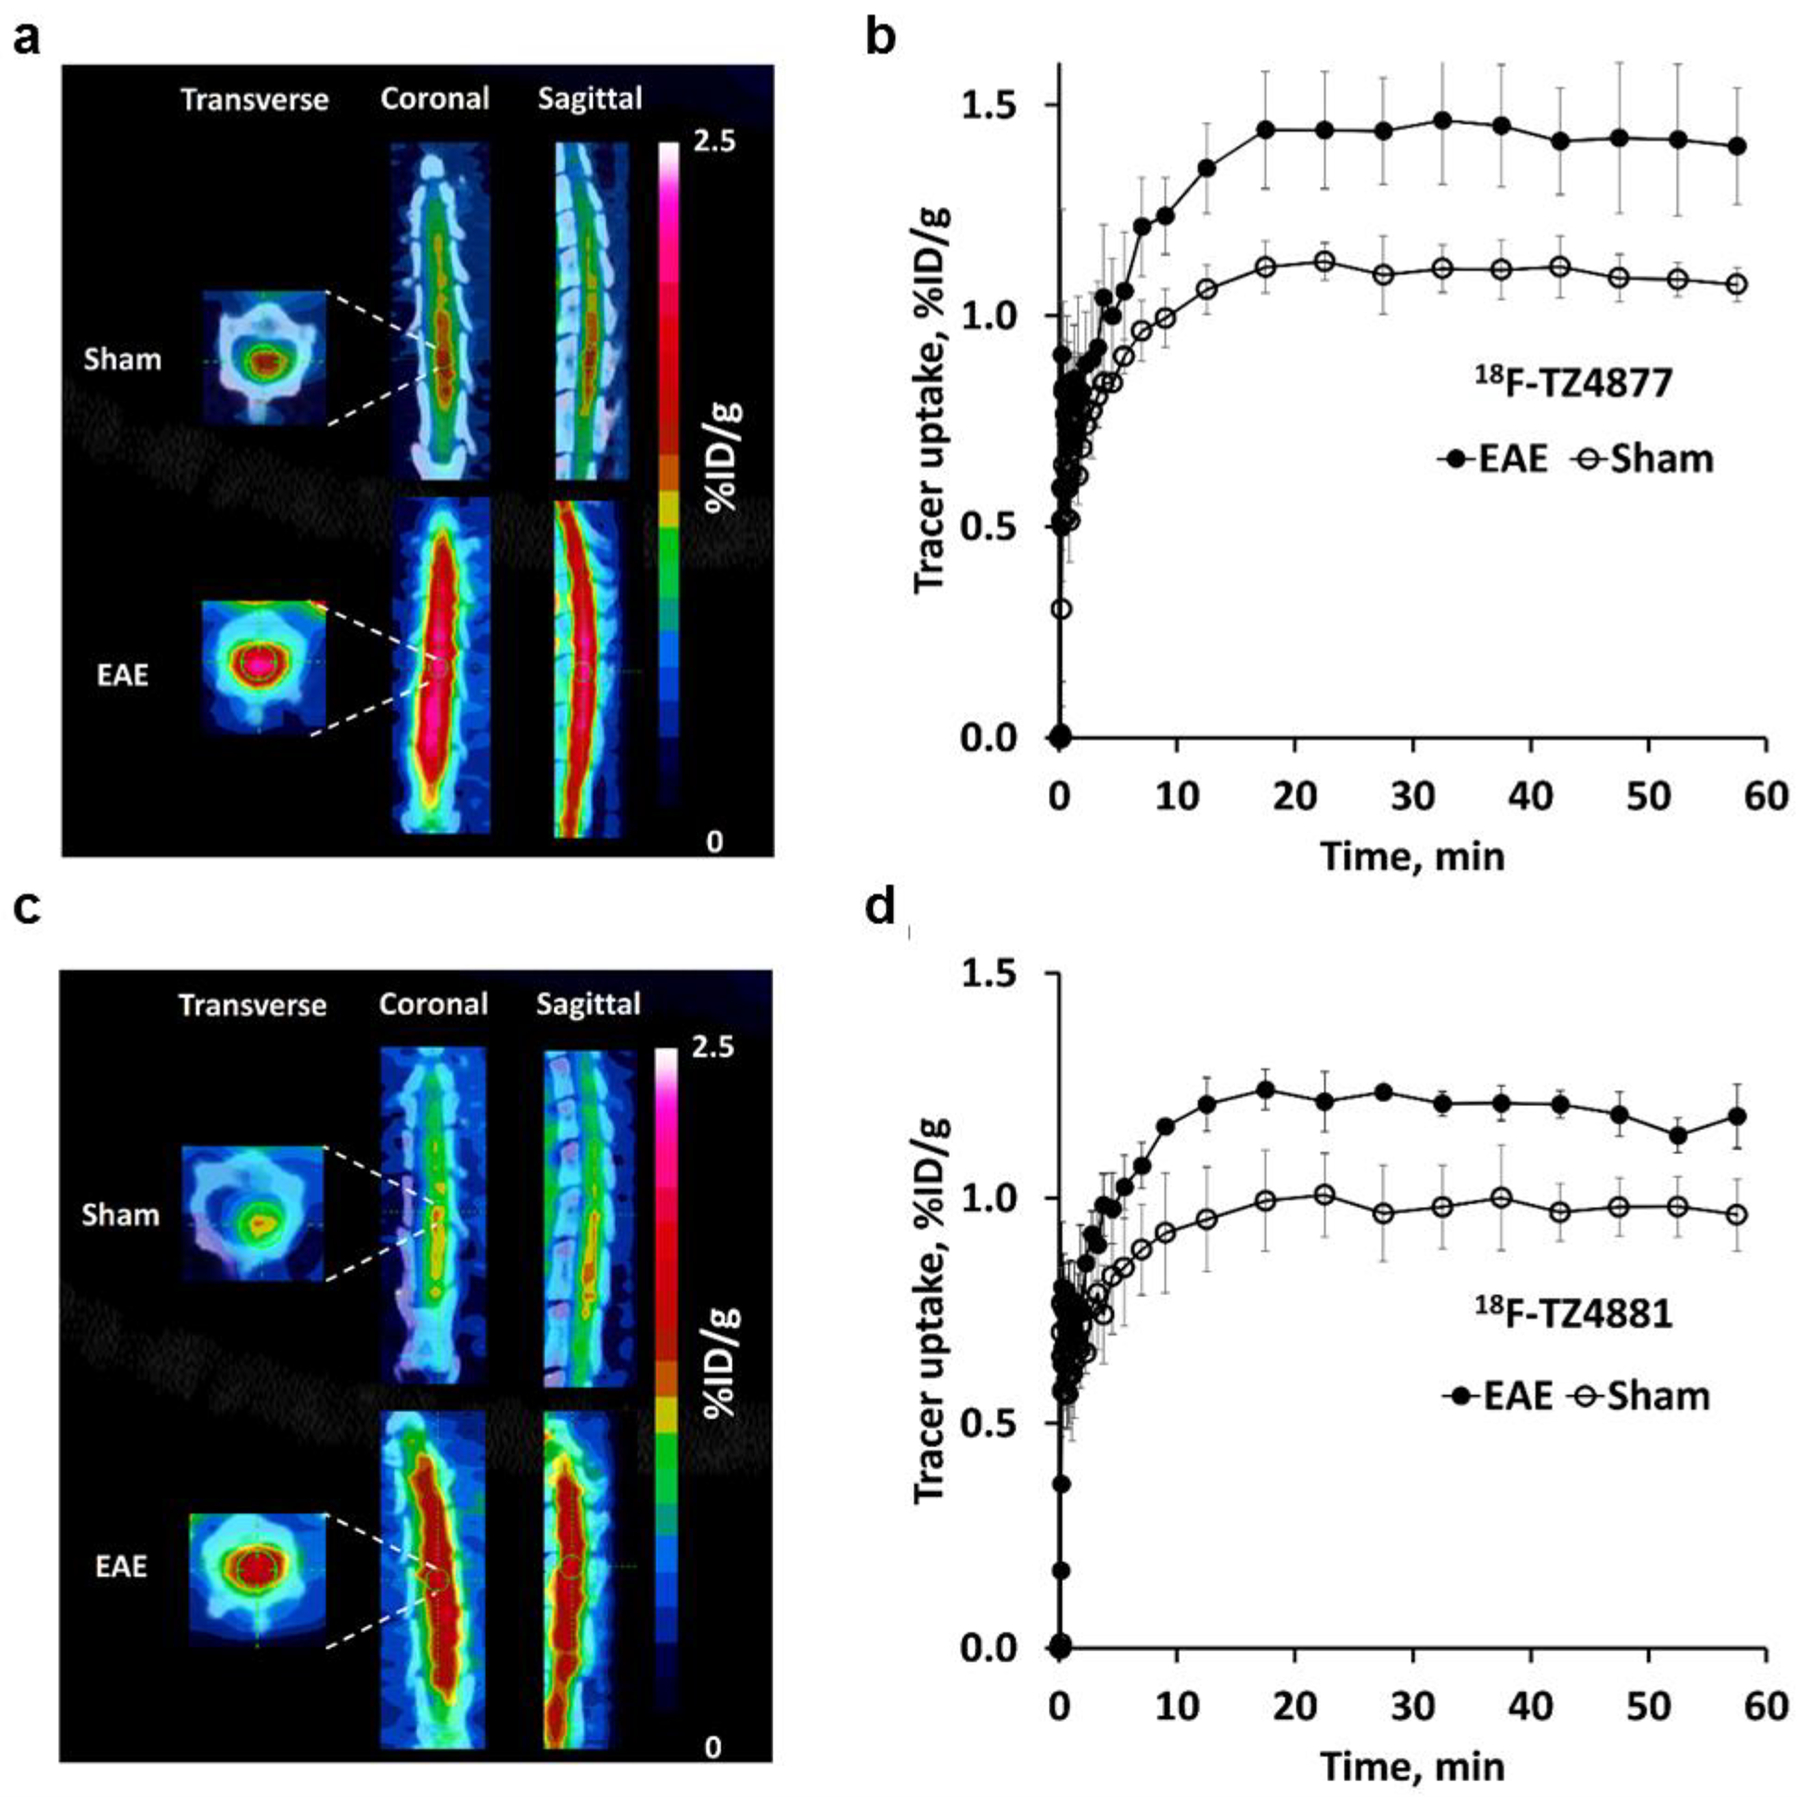
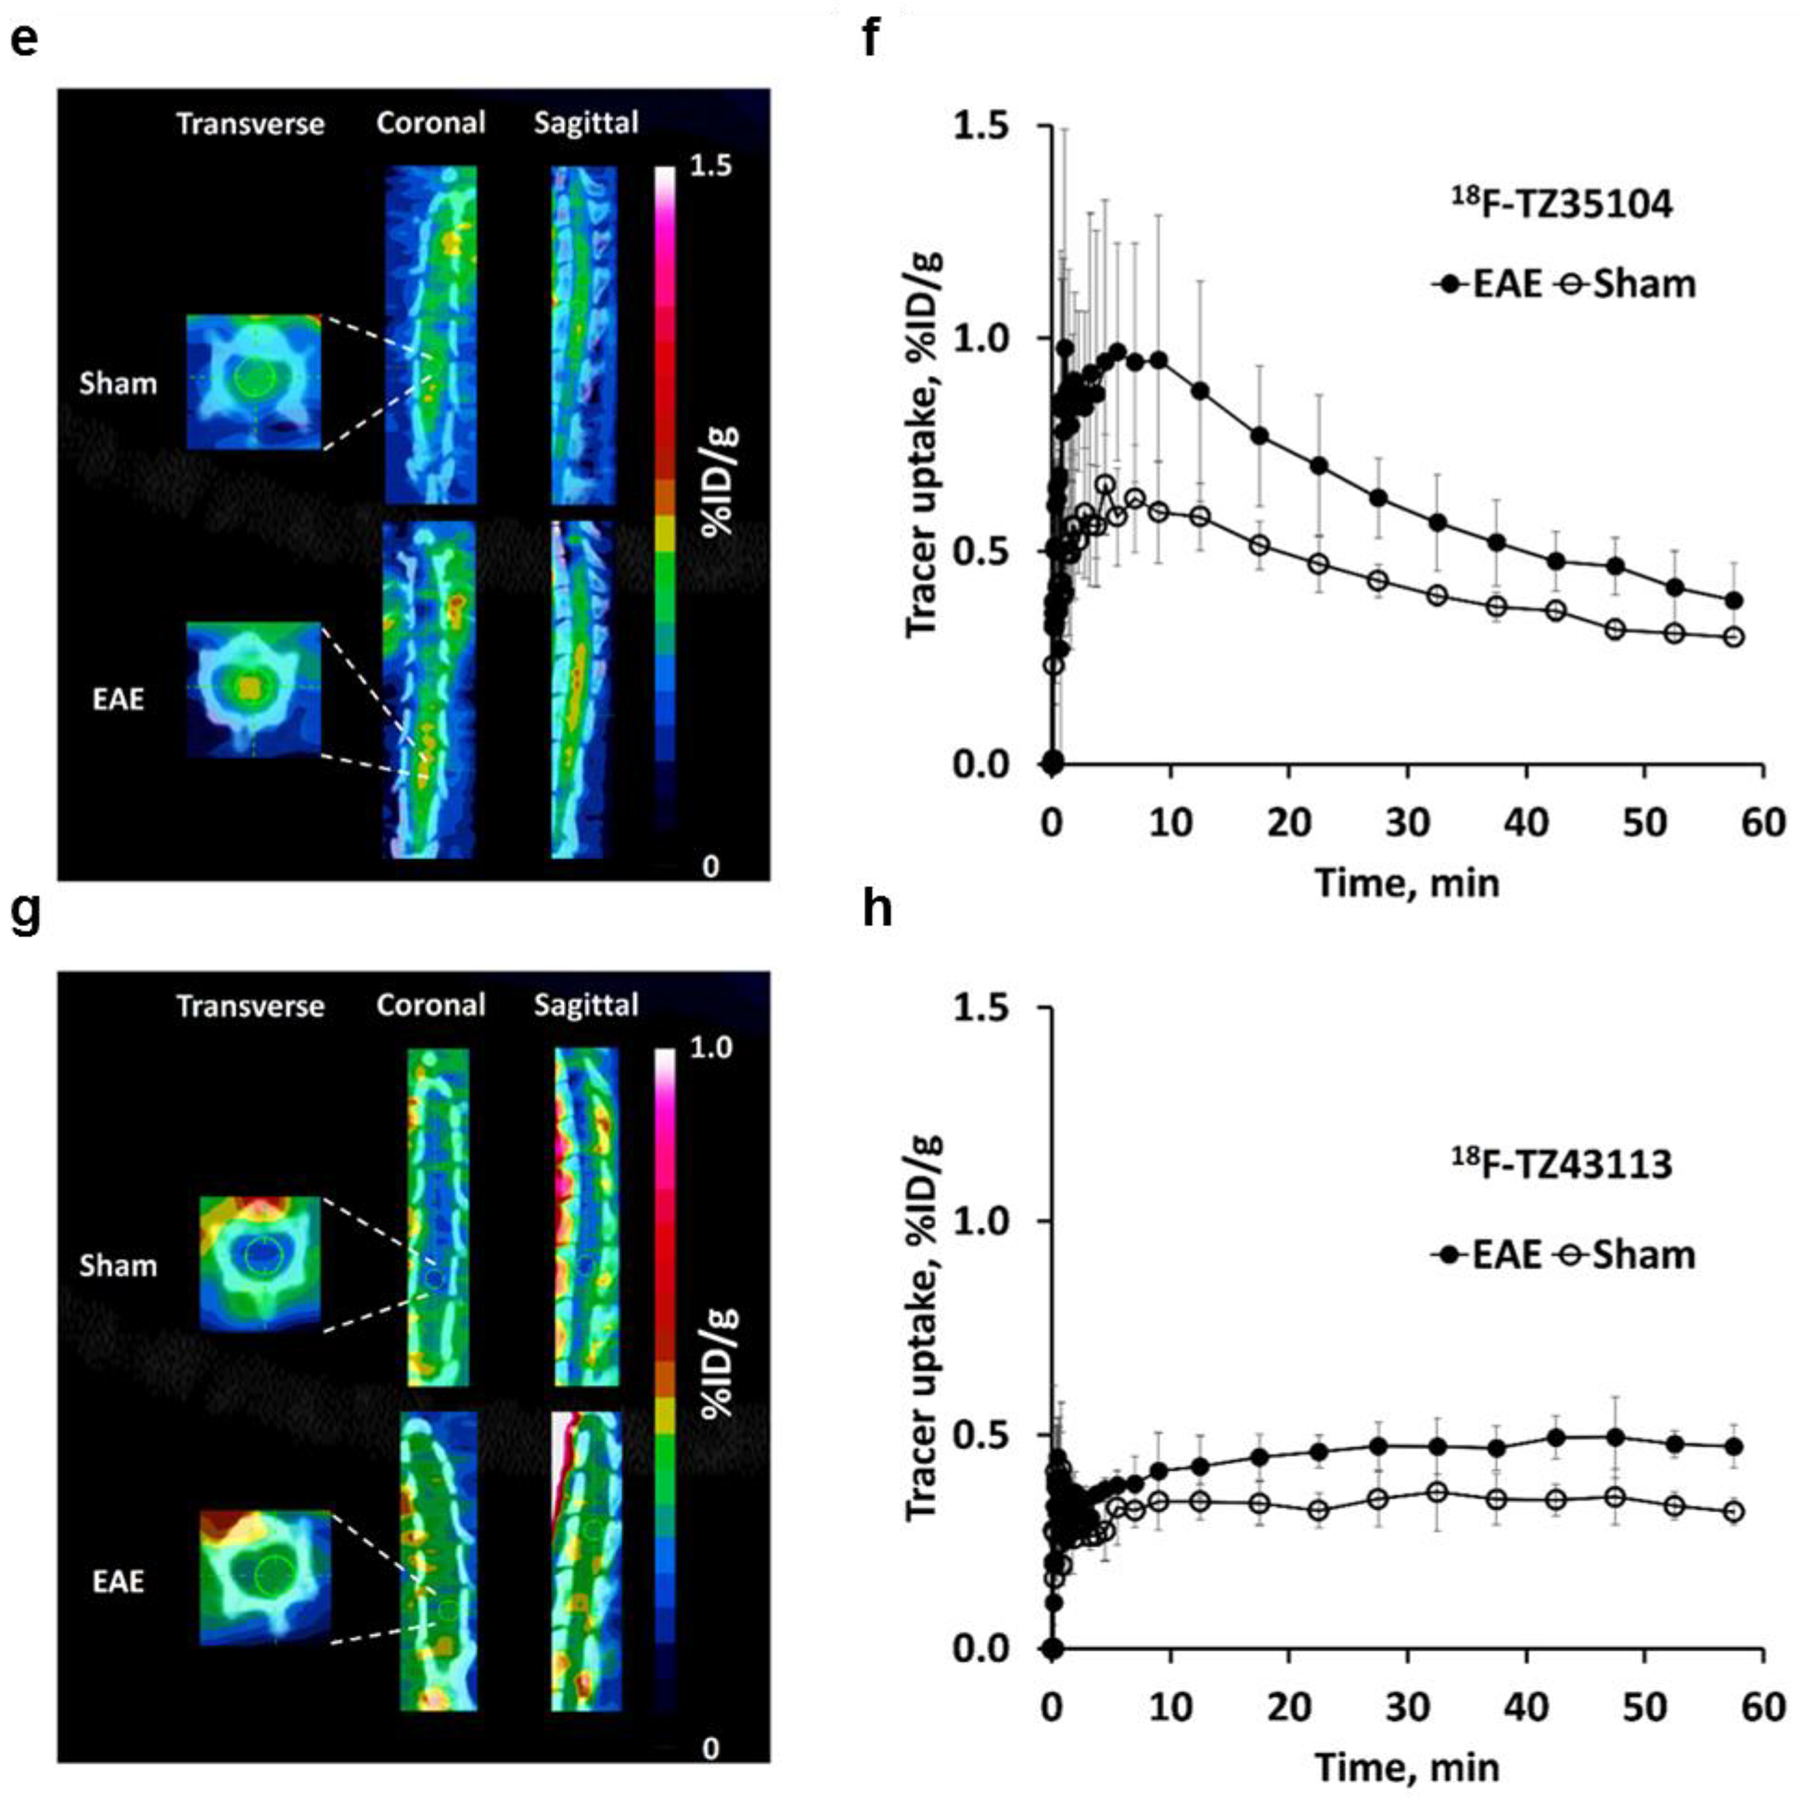
Figure 1.


MicroPET studies of 18F-TZ4877 (a&b), 18F-TZ4881 (c&d), 18F-TZ35104 (e&f) and 18F-TZ43113 (g&h) in the EAE rat model. Representative microPET/CT images and time-activity curves for each tracer showed significantly increased uptake in EAE rat lumbar spinal cord, compared to shams. Images are summed from 0–60 min. The error bars are standard deviation (SD). n = 3–4 for each group. EAE, experimental autoimmune encephalomyelitis.
