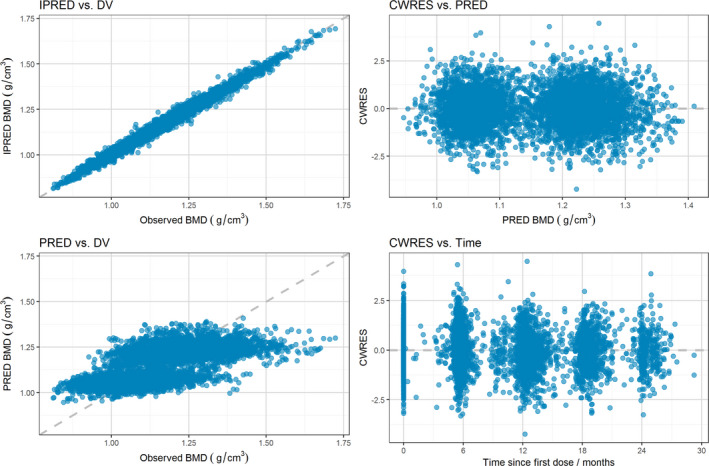
Figure 1.

Goodness‐of‐fit plots for the final exposure‐BMD model. Note: Individual predicted (IPRED; upper left) and population predicted (PRED; lower left) vs. observed (DV) lumbar spine bone mineral density (BMD) and conditional weighted residuals (CWRES) vs. population predicted lumbar spine BMD (upper right) and vs. time (lower right).
