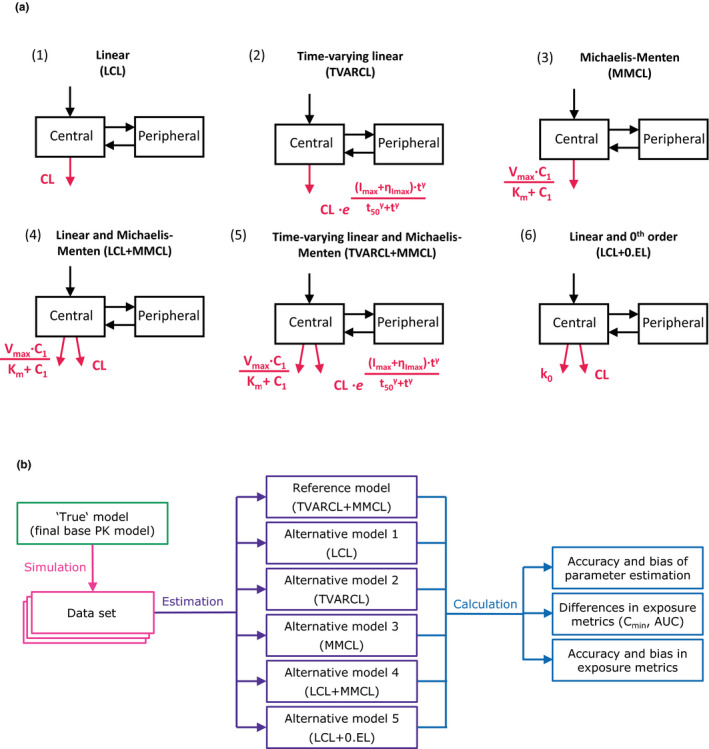
Figure 2.

Overview of the analysis workflow. (a) Graphical representation of the investigated base pharmacokinetic (PK) models for cetuximab. (b) Flowchart illustrating the stochastic simulation and estimation (SSE) analysis per study design scenario. The final PK base (reference, “true”) model was used to simulate 200 data sets in the stochastic simulation step. The reference and five alternative models were subsequently fit to the simulated datasets. Thus, altogether 6 × 200 = 1,200 model fits were performed. For each model accuracy and bias of parameter estimates, exposure metrics (AUC and C min after the second dose and in steady state), and their bias and accuracy were calculated and compared. The process was repeated for four study designs in total differing in sampling density and number of dose levels. C1 denotes drug concentration in central compartment; C 2, drug concentration in peripheral compartment; CL, linear clearance from central compartment; I max, maximum change in time‐varying linear clearance; K m, concentration at half V max; k 0, zero‐order rate constant of elimination from central compartment; ηI max, between‐patient variability in I max; Q, intercompartmental exchange rate; t 50, time at which clearance is halved; V max, maximal rate of saturable elimination; γ, curve shape factor. Parts of the model related to clearance are shown in red.
