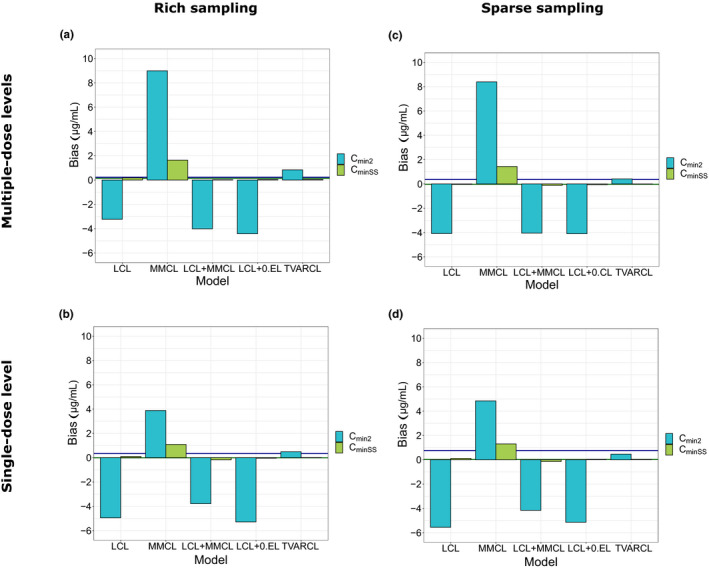
Figure 3.

Bias in minimum concentration after the second (C min2) dose and C min in steady–state (C minSS) compared with reference MMCL + TVARCL model. (a) Study design A: multiple‐dose levels and rich sampling. (b) Study design B: single‐dose level and rich sampling. (c) Study design C: multiple‐dose levels and sparse sampling. (d) Study design D: single‐dose level and sparse sampling. Horizontal lines represent “background” bias for the reference model compared with the simulated observations. 0.EL, zero‐order clearance; LCL, linear clearance; MMCL, Michaelis‐Menten clearance; TVARCL, time‐varying linear clearance
