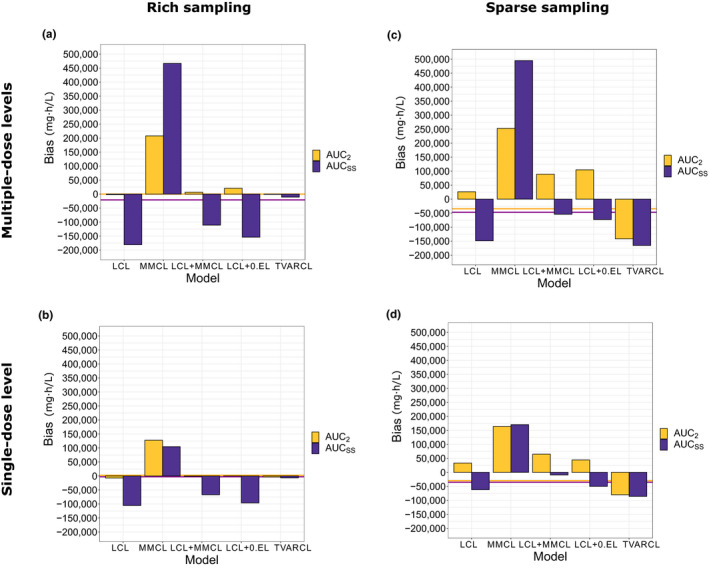
Figure 4.

Bias in AUC after the second dose and AUC in steady‐state compared with reference MMCL + TVARCL model. (a) Study design A: multiple‐dose levels and rich sampling. (b) Study design B: single‐dose level and rich sampling. (c) Study design C: multiple‐dose levels and sparse sampling. (d) Study design D: single‐dose level and sparse sampling. Horizontal lines represent “background” bias for the reference model compared to the individual predictions from the original, reference model, used for simulations. AUC, area under the curve; AUCss, area under the curve in steady‐state; 0.EL, zero‐order clearance; LCL, linear clearance; MMCL, Michaelis‐Menten clearance; TVARCL, time‐varying linear clearance.
