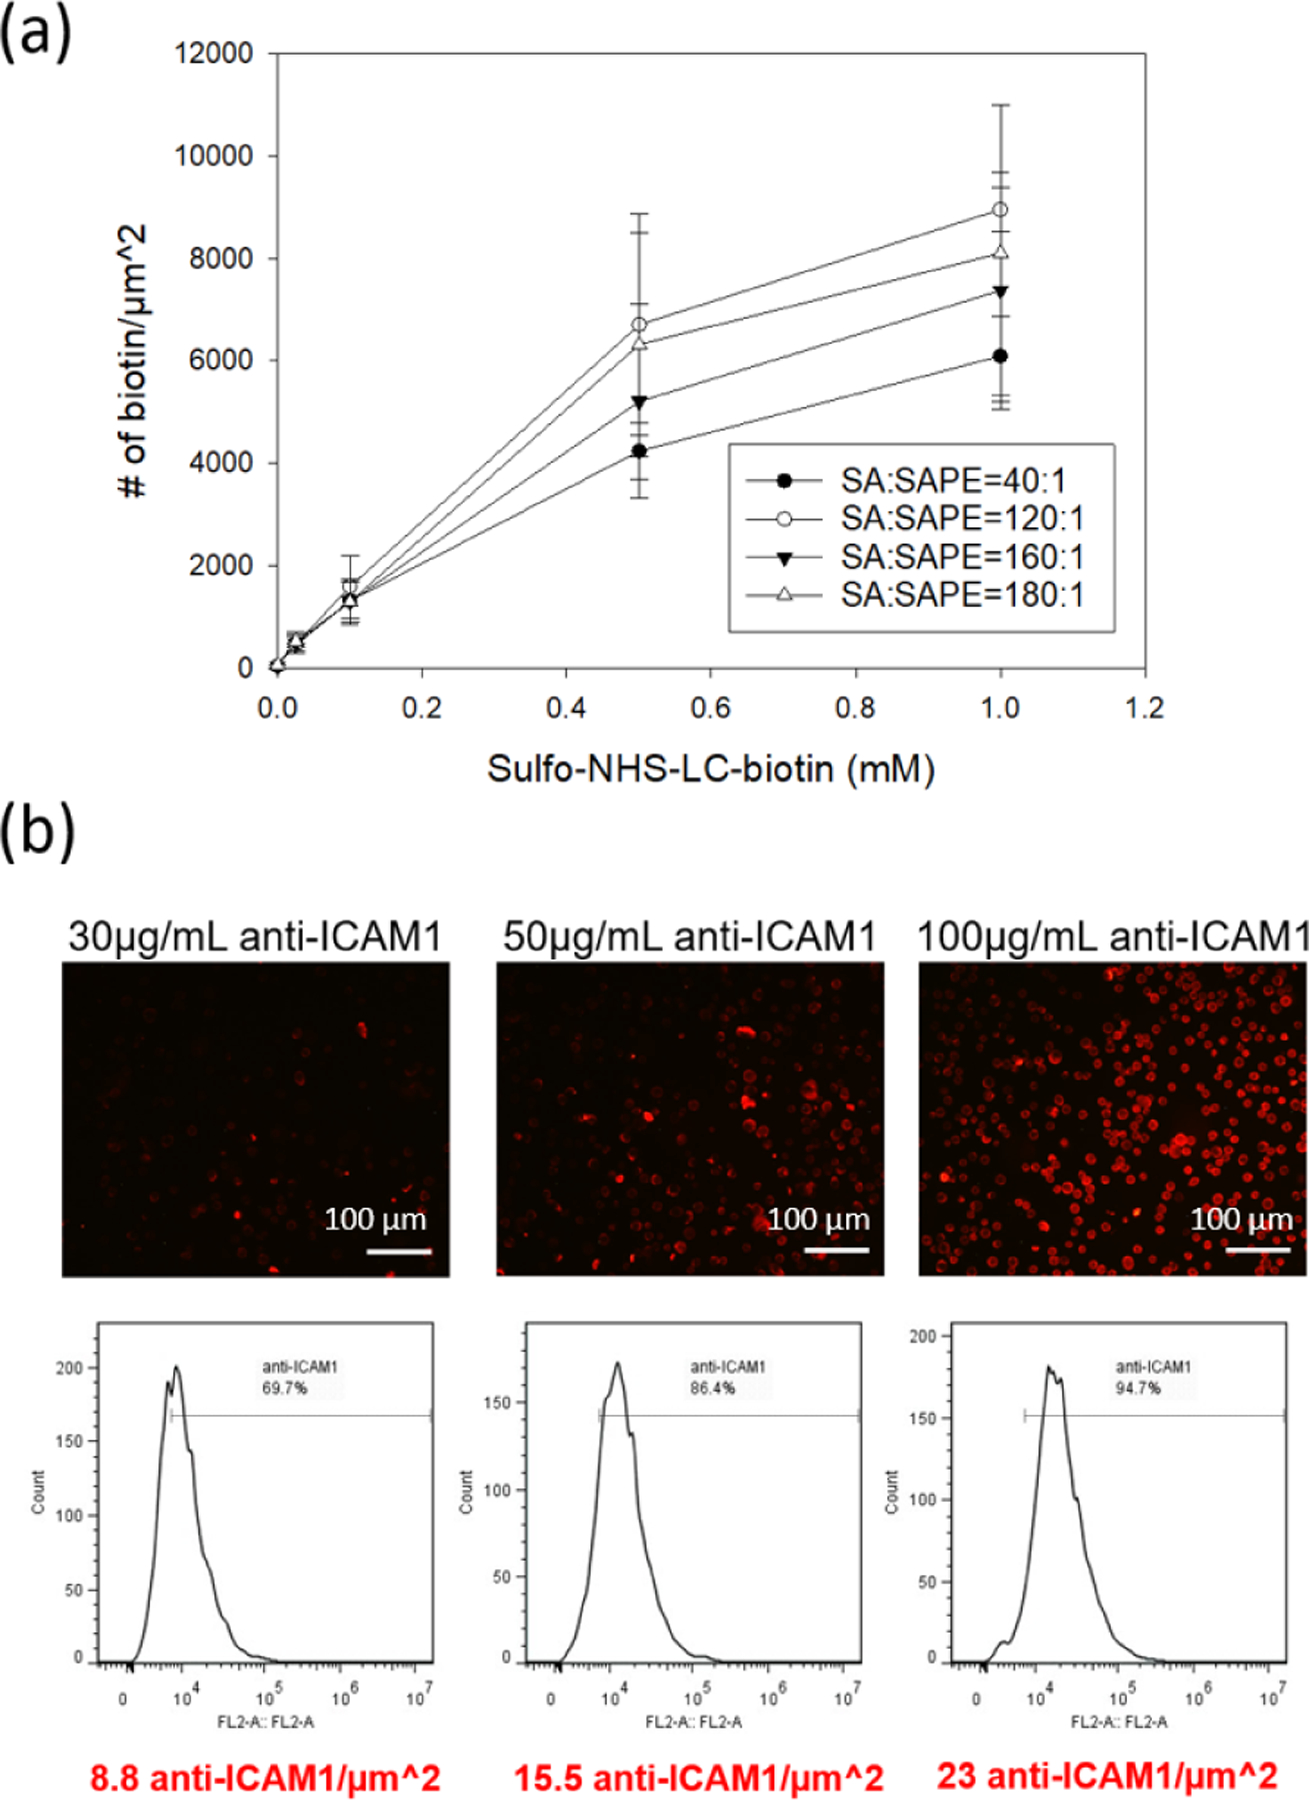
Figure 3. Quantitation of surface biotin density on biotinylated MSCs.

(a) Quantitation of biotin groups through competitive binding of SA/SAPE on biotinylated cells. The ester-biotin treated cells were stained with four different ratios of SA to SAPE. (b) Quantitation of ICAM1 antibodies on the MSC surface with different antibody concentrations (30, 50 and 100 μg/mL) through secondary PE labeling. The scale bar is 100 μm.
