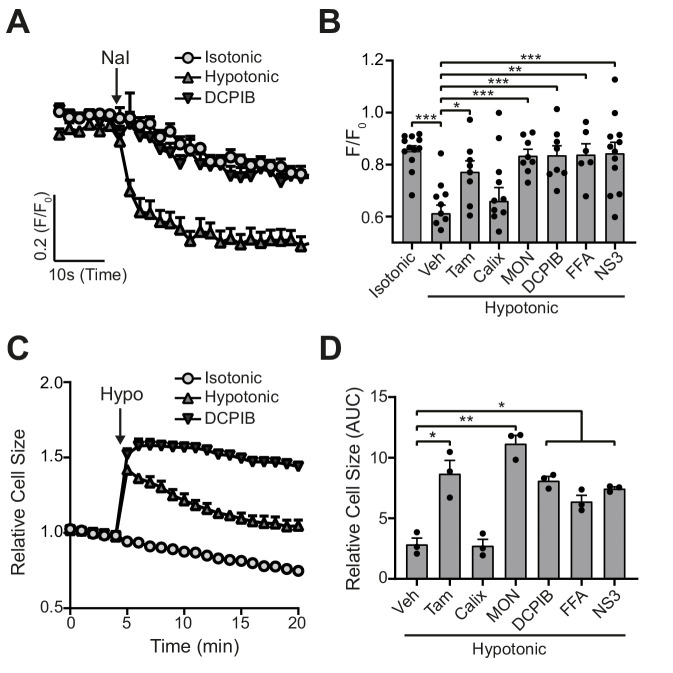
Figure 2. VRAC inhibitors block hypotonicity-induced Cl- channel opening and regulatory volume decrease (RVD).
(A) Cl- channel opening measured in HeLa cells transiently expressing the halide-sensitive EYFP (H148Q/I152L). HeLa cells were pre-treated with a vehicle control (DMSO) or DCPIB (10 µM) and incubated in an isotonic (310 mOsm kg−1) or hypotonic (215 mOsm kg−1) solution for 5 min before quenching by addition of NaI (40 mM). (B) Normalised EYFP (H148Q/I152L) fluorescence values from HeLa cells pre-treated with either a vehicle control (DMSO), tamoxifen (Tam, 10 µM), 4-sulfonic calix[6]arene (Calix, 100 µM), MONNA (MON, 50 µM), DCPIB (10 µM), flufenamic acid (FFA, 100 µM) or NS3728 (NS3, 10 µM). Cells were incubated an isotonic (310 mOsm kg−1) or hypotonic (215 mOsm kg−1) solution for 5 min before quenching by addition of NaI. Fluorescent measurement was taken 30 s after NaI addition (n = 6–12). (C) Relative cell size of murine bone-marrow-derived macrophages (BMDMs) incubated in isotonic (340 mOsm kg−1) or hypotonic (117 mOsm kg−1) solution, pre-treated with a vehicle control (DMSO) or DCPIB (10 µM). BMDMs were labelled with the fluorescent dye calcein and area of fluorescence was measured over time. (D) Area under the curve of BMDMs incubated in a hypotonic solution (117 mOsm kg−1) in the presence of either a vehicle control (DMSO), tamoxifen (Tam, 10 µM), 4-sulfonic calix[6]arene (Calix, 100 µM), MONNA (MON, 50 µM), DCPIB (10 µM), flufenamic acid (FFA, 100 µM) or NS3728 (NS3, 10 µM) (n = 3). *p<0.05, **p<0.01, ***p<0.01 determined by a one-way ANOVA with Dunnett’s (vs vehicle control) post hoc analysis. Values shown are mean plus the SEM.

