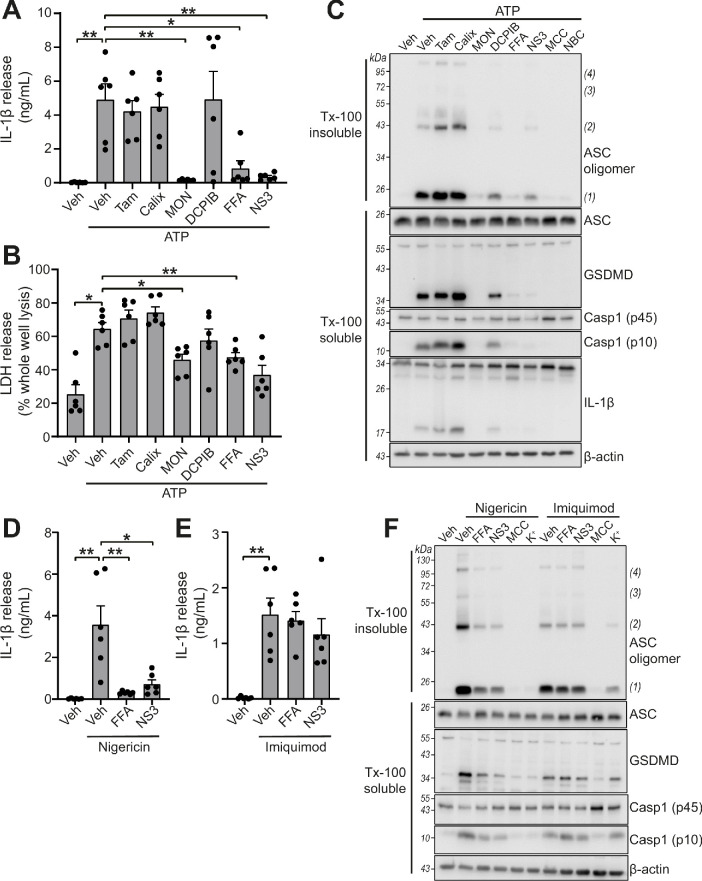
Figure 3. VRAC inhibitors differentially regulate NLRP3.
(A) IL-1β release was determined by ELISA on supernatants from murine bone marrow derived macrophages (BMDMs). LPS-primed (1 µg mL−1, 4 hr) BMDMs were pre-treated with either a vehicle control (DMSO), tamoxifen (Tam, 10 µM), 4-sulfonic calix[6]arene (Calix, 100 µM), MONNA (MON, 50 µM), DCPIB (10 µM), flufenamic acid (FFA, 100 µM), or NS3728 (NS3, 10 µM) before stimulation with ATP (5 mM, 2 hr) (n = 6). (B) Cell death determined by an LDH assay of cells treated in (A). (C) Western blot of Triton x-100 insoluble crosslinked ASC oligomers and soluble total BMDM cell lysates (cell lysate + supernatant) probed for ASC, GSDMD, caspase-1 and IL-1β. LPS-primed (1 µg mL−1, 4 hr) BMDMs were pre-treated with either a vehicle control (DMSO), tamoxifen (Tam, 10 µM), 4-sulfonic calix[6]arene (Calix, 100 µM), MONNA (MON, 50 µM), DCPIB (10 µM), flufenamic acid (FFA, 100 µM), NS3728 (NS3, 10 µM) or the NLRP3 inhibitors MCC950 (MCC, 10 µM) and NBC19 (NBC, 10 µM) before stimulation with ATP (5 mM, 2 hr) (n = 3). (D) IL-1β release from LPS-primed (1 µg mL−1, 4 hr) BMDMs pre-treated with a vehicle control (DMSO), flufenamic acid (FFA, 100 µM), or NS3728 (NS3, 10 µM) before stimulation with nigericin (10 µM, 2 hr) (n = 6). (E) IL-1β release from LPS-primed (1 µg mL−1, 4 hr) BMDMs pre-treated with a vehicle control (DMSO), flufenamic acid (FFA, 100 µM) or NS3728 (NS3, 10 µM) before stimulation with imiquimod (75 µM, 2 hr) (n = 6). (F) Western blot of Triton x-100 insoluble crosslinked ASC oligomers and soluble total BMDM cell lysates (cell lysate + supernatant) probed for ASC, GSDMD, and caspase-1. LPS-primed (1 µg mL−1, 4 hr) BMDMs were pre-treated with either a vehicle control (DMSO), flufenamic acid (FFA, 100 µM), NS3728 (NS3, 10 µM), the NLRP3 inhibitor MCC950 (MCC, 10 µM) or KCl (K+, 25 mM) before stimulation with nigericin (10 µM, 2 hr) or imiquimod (75 µM, 2 hr) (n = 3). *p<0.05, **p<0.01, determined by a one-way ANOVA with Dunnett’s (vs vehicle control) post hoc analysis. Values shown are mean plus the SEM.


