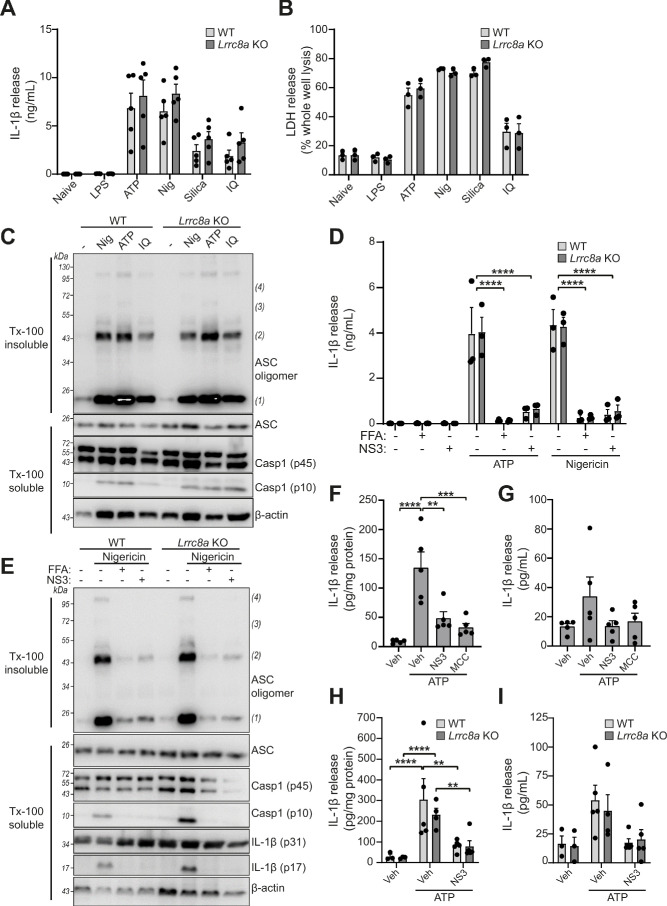
Figure 5. LRRC8A is dispensable for activation of the NLRP3 inflammasome.
(A) IL-1β release was determined by ELISA on supernatants from wild-type (WT) or Lrrc8a knockout (KO) bone-marrow-derived macrophages (BMDMs). Naïve or LPS-primed (1 µg mL−1, 4 hr) BMDMs were stimulated with either vehicle, ATP (5 mM), nigericin (Nig, 10 µM), silica (300 µg mL−1) or imiquimod (IQ, 75 µM) for 2 hr (n = 5). (B) Cell death determined by an LDH assay of cells treated in (A) (n = 3). (C) Western blot of Triton x-100 insoluble crosslinked ASC oligomers and soluble total BMDM cell lysates (cell lysate + supernatant) probed for ASC and caspase-1. LPS-primed (1 µg mL−1, 4 hr) WT or Lrrc8a KO BMDMs were stimulated with either nigericin (Nig, 10 µM), ATP (5 mM) or imiquimod (IQ, 75 µM) for 2 hr (n = 3). (D) IL-1β release from LPS-primed (1 µg mL−1, 4 hr) WT or Lrrc8a KO BMDMs pre-treated with a vehicle control (DMSO), flufenamic acid (FFA, 100 µM) or NS3728 (NS3, 10 µM) and then stimulated with ATP (5 mM) or nigericin (10 µM) for 2 hr (n = 3). (E) Western blot of Triton x-100 insoluble crosslinked ASC oligomers and soluble total BMDM cell lysates (cell lysate + supernatant) probed for ASC, caspase-1 and IL-1β. LPS-primed (1 µg mL−1, 4 hr) WT or Lrrc8a KO BMDMs were pre-treated with a vehicle control, flufenamic acid (FFA, 100 µM) or NS3728 (NS3, 10 µM) and stimulated with nigericin (10 µM, 2 hr) (n = 5). (F–G) IL-1β detected by ELISA in the peritoneal lavage (F) or plasma (G) from WT mice. Mice were pre-treated intraperitoneally (i.p.) with a vehicle control, NS3728 (NS3, 50 mg kg−1) or MCC950 (MCC, 50 mg kg−1) and LPS (1 µg). 4 hr after injection with LPS, mice were anaesthetised and injected with additional vehicle control, NS3728 (NS3, 50 mg kg−1) or MCC950 (MCC, 50 mg kg−1) before i.p. injection of ATP (100 mM, 500 µL, 15 min) (n = 5). (H–I) IL-1β detected by ELISA in the peritoneal lavage (H) or plasma (I) from Lrrc8a KO and WT littermates as treated in (F) (n = 3–5). **p<0.01, ***p<0.001, ****p<0.0001 determined by a one-way ANOVA with Dunnett’s (vs vehicle control) post hoc analysis (F,G) or a two-way ANOVA with Tukey’s post hoc analysis (A,B,D,H,I). Values shown are mean plus the SEM.


