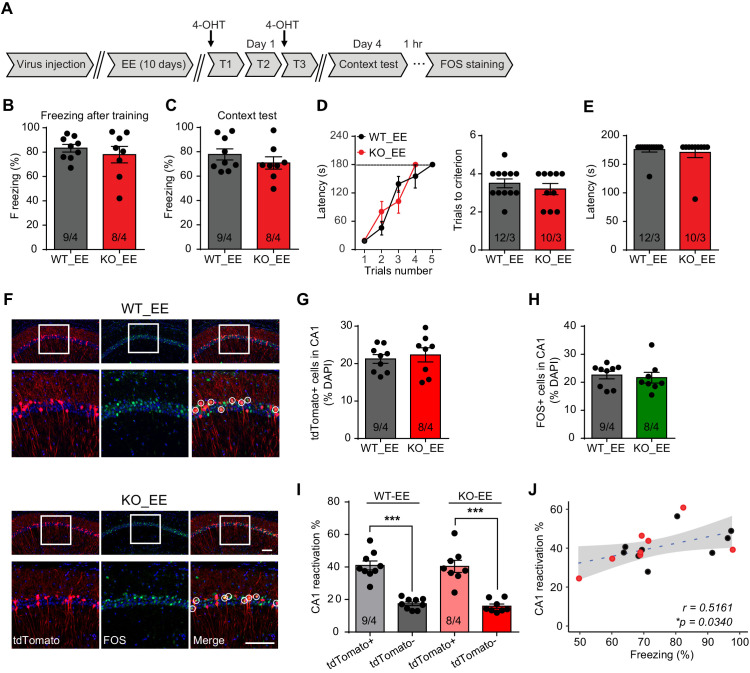
Figure 3. Enriched environment experience rescues fear memory deficits in Fmr1 KO mice by improving engram reactivation efficacy during memory recall.
(A) Experimental protocol for EE, memory-encoding neural ensemble and reactivation labeling. (B and C) Contextual fear conditioning test. Freezing levels were measured immediately after fear conditioning training (B) and again in training context 3 days after (C). (D and E) Passive avoidance test. (D) Learning curves (left) and trials number to criterion (right) were measured during training, and contextual fear memory in passive avoidance was measured 1 day later (E). (F) Representative images showing memory-encoding neural ensembles (engram cells) labeled with tdTomato (red) and memory recall-activated neurons labeled with FOS immunostaining (green). The circles in zoomed in images highlight reactivated neurons (yellow). Scale bar: 100 μm. (G) Quantification of percentage of neurons activated during learning. (H) Quantification of percentage of neurons activated during memory recall. (I) Quantification of engram reactivation in CA1. Percent FOS-positive neurons in both tdTomato+ and tdTomato- populations were measured [one-way ANOVA with Tukey’s multiple comparison test: F (3, 30)=32.51, p<0.0001, ***p<0.001]. (J) Positive correlation between engram reactivation efficacy (percent FOS+ neurons in tdTomato+ population) and behavioral performance during contextual memory test (*p<0.05, Pearson correlation coefficient). n/N, number of mice/number of independent litters. All graphs represent mean ± SEM.


