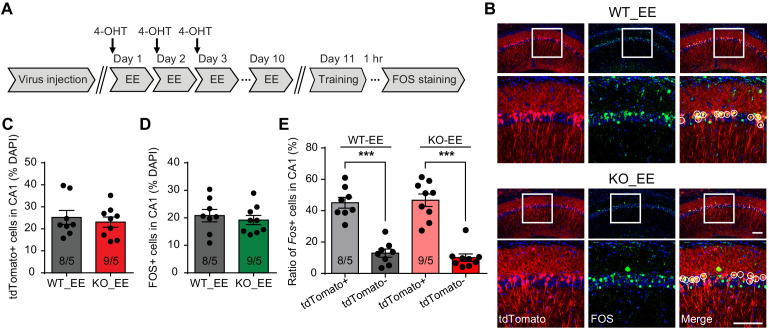
Figure 4. Neurons activated during enriched environment experience are more likely to become engram cells in subsequent learning.
(A) Experimental protocol for enriched environment (EE) and neural ensemble labeling. (B) Representative images of EE-activated neural ensembles labeled with tdTomato (red) and fear conditioning training-activated neurons labeled with FOS immunostaining (green). The circles in zoomed in images highlight reactivated EE-engaged cells during fear conditioning learning (yellow). Scale bar: 100 μm. (C) Quantification of percentage of neurons activated during EE. (D) Quantification of percentage of neurons activated during fear conditioning learning. (E) Quantification of neuronal activation during subsequent learning (FOS+) in EE-engaged (tdTomato+) and non-EE engaged (tdTomato-) populations [Kruskal-Wallis test with Dunn’s multiple comparison test: H (3)=24.75, p<0.001, ***p<0.001]. n/N, number of mice/number of independent litters. All graphs represent mean ± SEM.


