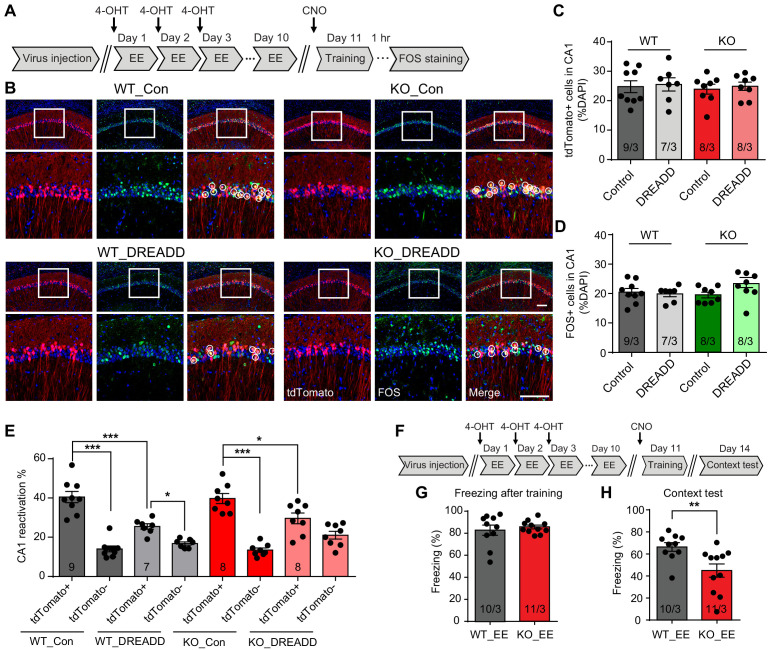
Figure 5. Inhibiting CA1 neurons activated by the enriched environment experience prevents memory improvement by EE in Fmr1 KO mice.
(A) Experimental protocol for chemogenetic inhibition of EE-activated neurons before fear conditioning training. (B) Representative images showing EE-activated neural ensembles labeled with tdTomato (red) and fear conditioning learning-activated neurons labeled with FOS immunostaining (green) in control and inhibitory DREADD-expressing mice CA1. The circles highlight reactivated EE-engaged cells during fear conditioning learning (yellow). Scale bar: 100 μm. (C) Quantification of neuronal activation by EE (Kruskal-Wallis test: H (3)=0.1518, p=0.9850). (D) Quantification of neuronal activation by fear conditioning learning (Kruskal-Wallis test: H (3)=5.669, p=0.1289). (E) Quantification of neuronal activation during subsequent learning (FOS+) in EE-engaged (tdTomato+) and non-EE engaged (tdTomato-) populations [WT group: two-way ANOVA: group factor, F(1, 28)=9.608, **p<0.01; interaction, F(1, 28)=20.22, ***p<0.001; Tukey post hoc test: ***p<0.001; *p<0.05. KO group: two-way ANOVA: group factor, F(1, 28)=0.3268, p=0.5721; interaction, F(1, 28)=16.29, ***p<0.001; Tukey post hoc test: ***p<0.001; *p<0.05]. (F) Experimental protocol for EE-activated neural ensemble inhibition and contextual fear memory test. (G and H) Contextual fear conditioning test. Freezing levels were measured immediately after fear conditioning training (G) and again in training context 3 days after (H) (**p<0.01, two-tailed Mann-Whitney U test). n/N, number of mice/number of independent litters. All graphs represent mean ± SEM.


