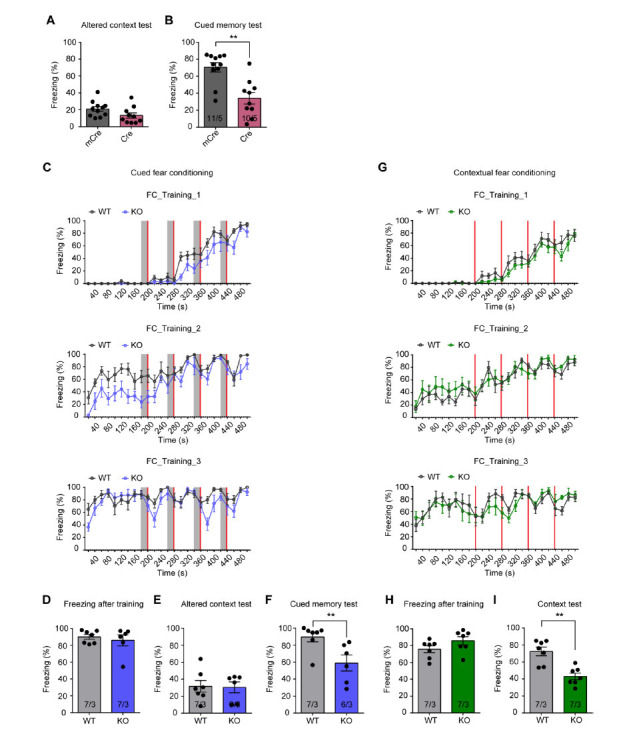
Author response image 1. Cued fear memory and contextual fear memory are both impaired in CA1-Fmr1 KO mice and constitutive Fmr1 KO mice.

(A and B) Altered context test and cued fear memory test in CA1-Fmr1 KO mice. Freezing levels in an altered context (A) and altered context with tone CS (B) were measured three days after training (**, p < 0.01, two-tailed Mann-Whitney U test). (C-F) Cued fear memory in constitutive Fmr1 KO mice. (C) Learning curves of constitutive Fmr1 KO mice in cued fear conditioning. The intensive fear conditioning training paradigm has three sessions, each consists of four pairs of co-terminating tone (20 s, gray bar) and foot shock (2 s, red bar). Freezing levels before, during and after each tone-shock pair were quantified (Two-way repeated measure ANOVA: training 1: group factor, F(1, 11) = 3.497, p = 0.0883; interaction, F(24, 264) = 1.776, *, p < 0.05; training 2: group factor, F(1, 11) = 14.90, **, p < 0.01; interaction, F(24, 264) = 1.150, p = 0.2899; training 3: group factor, F(1, 11) = 2.745, p = 0.1258; interaction, F(24, 264) = 1.632, *, p < 0.05). (D) Freezing levels measured immediately after fear conditioning training. (E) Freezing levels in an altered context and (F) altered context with tone CS were measured three days after training (**, p < 0.01, two-tailed Mann-Whitney U test). (G-I) Contextual fear memory in constitutive Fmr1 KO mice. (G) Learning curves of constitutive Fmr1 KO mice in contextual fear conditioning. The intensive fear conditioning training paradigm has three sessions, each consists of four foot shock (2 s, red bar) delivered at 198 s, 278 s 358 s and 438 s. Freezing levels before, during and after each shock were quantified (Two-way repeated measure ANOVA: training 1: group factor, F(1, 12) = 1.497, p = 0.2446; interaction, F(24, 288) = 0.8571, p = 0.6612; training 2: group factor, F(1, 12) = 0.4586, p = 0.5111; interaction, F(24, 288) = 0.7814, p = 0.7597; training 3: group factor, F(1, 12) = 0.1740, p = 0.6839; interaction, F(24, 288) = 0.8450, p = 0.6775). Freezing levels were measured immediately after fear conditioning training (H) and again in training context three days after (I) (**, p < 0.01, two-tailed Mann-Whitney U test). n/N, number of mice/number of independent litters. All graphs represent mean ± SEM.
