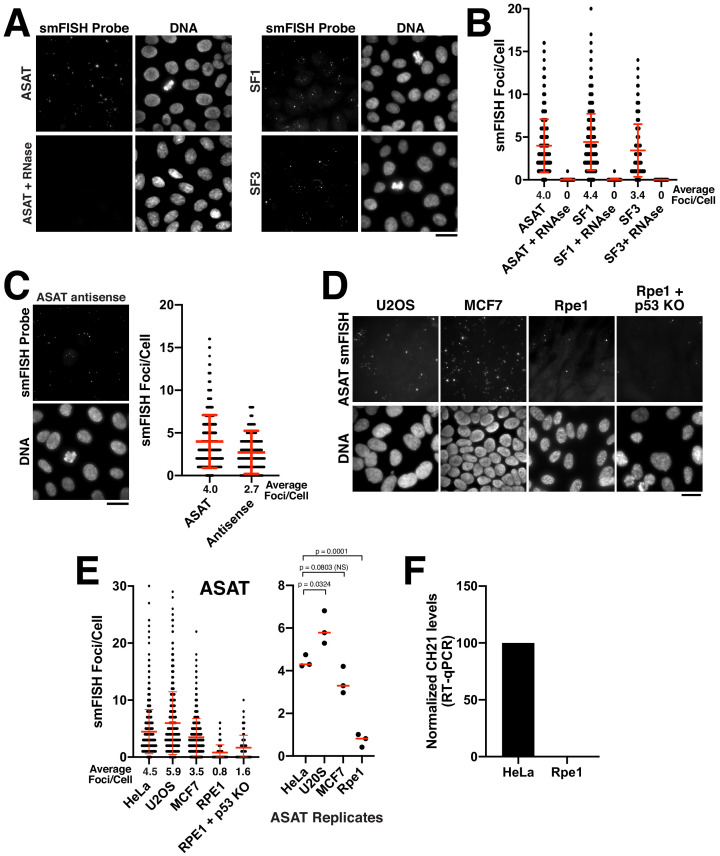
Figure 1. Quantitative detection of centromere RNAs using smFISH.
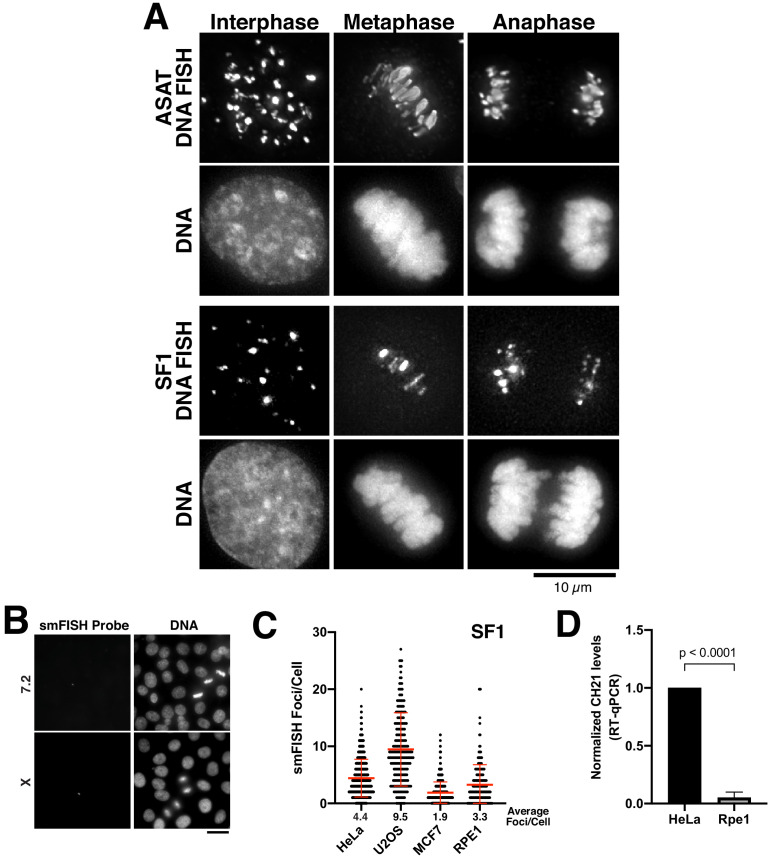
(A) Detection of alpha-satellite RNA transcripts by smFISH in asynchronous HeLa cells. Designed probes detected RNAs derived from centromeres across subsets of multiple chromosomes, but with distinct specificity (see Supplementary file 2; ASAT, SF1, and SF3 repeats). Treatment of cells with RNase A prior to hybridization diminished RNA-smFISH signals. (B) Quantification of smFISH foci in the presence or absence of RNase A treatment indicates that the signal observed is due to a ribonucleic source. Points represent the number of foci per cell for each cell test. Error bars represent the mean and standard deviation of at least 100 cells. (C) Detection of anti-sense alpha-satellite transcripts in HeLa cells for the ASAT smFISH probe sequences. Error bars represent the mean and standard deviation of at least 100 cells. (D) Images showing varying abundance of alpha-satellite RNA across cell lines (based on smFISH foci), with RPE-1 cells displaying overall lower levels of centromere smFISH foci. For the RPE-1 + p53 KO condition, p53 was eliminated using an established TP53 iKO cell line (McKinley and Cheeseman, 2017). (E) Left, quantification indicating the variation of smFISH foci across selected cell lines. Error bars represent the mean and standard deviation of at least 100 cells. Right, average smFISH foci/cell for multiple independent replicates to enable statistical comparisons. p-values represent T-tests conducted on replicates of smFISH foci numbers for each selected cell line. (F) Graph showing quantification of RT-qPCR for alpha-satellite transcripts from chromosome 21. Levels of chromosome 21 alpha-satellite RNAs was not detected in Rpe1 cells and was therefore set to 0 in the figure. The levels of alpha-satellite transcripts in RPE-1 cells are reduced compared to HeLa cells. A semi-quantitative assessment of the RT-PCR data (with no standard curve interpolation, see Figure 1—figure supplement 1D) indicated a ~ 20-fold reduction in alpha-satellite transcripts in RPE-1 cells relative to HeLa. We performed three biological replicates of the RT-qPCR. Scale bars, 25 µm.


