. 2020 Nov 11;9:e59770. doi: 10.7554/eLife.59770

Figure 5. The nucleolus represses centromere RNA production.

(A) Immunofluorescence of HeLa (Top) and RPE1 (Bottom) cells showing the colocalization of centromeres with the nucleolus, as marked with antibodies against Ki-67 and anti-centromere antibodies (ACA). Scale bars, 10 µm. (B) Quantification reveals RPE1 cells have a greater fraction of centromeres that overlap with nucleoli (57%) compared to HeLa cells (44.6%). Error bars represent the mean and standard deviation of 25 cells. (C) Immunofluorescence of HeLa control (top) and HeLa CENP-C iKO (bottom) cells showing the colocalization of centromeres with the nucleolus, as marked with antibodies against Ki-67 and CENP-A. Scale bar, 10 µm. (D) Quantification reveals that depletion of CENP-C results in a reduced fraction of nucleoli-localized centromeres (32.8%) compared to control cells (44.6%). The asterisk indicates that the data from control cells is repeated from (B). Error bars represent the mean and standard deviation of 25 cells. (E) Graph showing the relationship between the number of ASAT smFISH foci (summarized from data in Figures 14) and the fraction of nucleolar-localized centromeres in the indicated conditions. RNA Polymerase I inhibition should eliminate nucleolar function, and so is listed as ‘0’ for nucleolar centromeres. Dashed line shows a linear fit trendline. (F) smFISH analysis reveals an increase of alpha-satellite transcripts in Ki67 knockout cells (right) when compared to control (left). Scale bar, 25 µm. (G) Quantification reveals a 2–3 fold increase in alpha-satellite transcript levels for both the ASAT and SF1 smFISH probes in Ki67 stable knockout cells. Error bars represent the mean and standard deviation of at least 100 cells. Right, graph showing replicates of the indicated data. P-values indicate T-tests for ASAT and SF1 replicates for Ki67 knockout cells compared to the corresponding control.

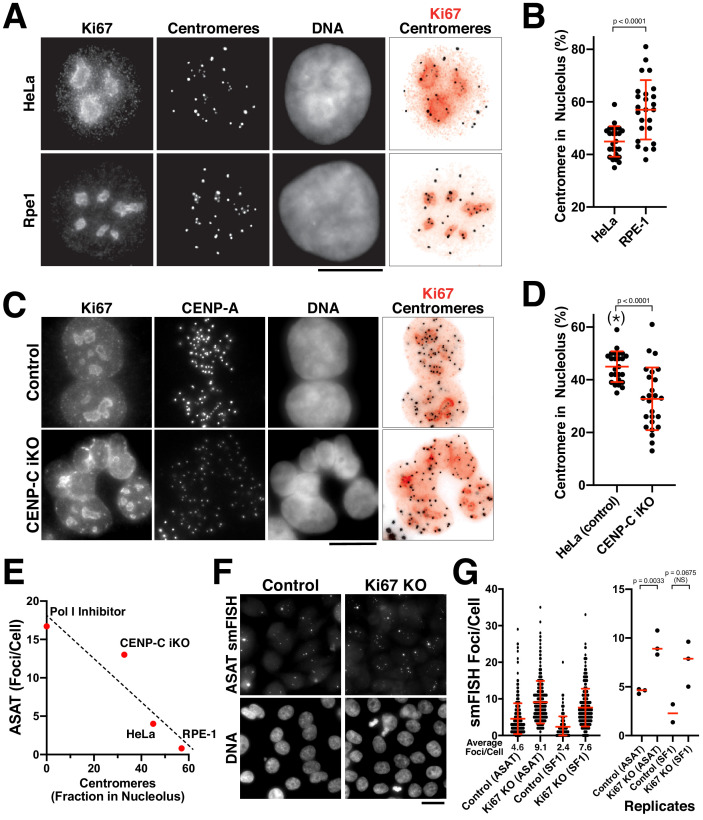
Figure 5.

Figure 5—figure supplement 1. Analysis of centromere-nucleolar contacts.

Figure 5—figure supplement 1.

(A) Immunofluorescence of HeLa (top) and RPE-1 cell (bottom) showing the colocalization of centromeres with the nucleolus, as marked with antibodies against Fibrillarin and centromeres (ACA). (B) Quantification reveals that depletion of CENP-B does not affect centromere-nucleolar associations. (C) Induction of Ki67 and Fibrillarin knockouts results in increased levels of alpha-satellite transcription, particularly for Ki-67, as tested by both ASAT and SF1 probe sets. The cell lines used for this experiment represent inducible knockout cells, in contrast to the stable Ki67 knockout analyzed in Figure 5F,G. Error bars represent the mean and standard deviation of at least 240 cells. (D) Validation of Ki67 stable knockout via immunofluorescence using antibodies against Ki67. Control cells (top) display clear Ki67 localization when compared to the clonal knockout cell line (bottom). Despite the persistently increased alpha-satellite transcript levels, there was no notable consequences to centromere protein levels (based on the localization of CENP-A). (E) RT-qPCR for alpha-satellite transcripts from chromosome 21 reveals no significant change in alpha-satellite transcript levels for the Ki67 knockout despite a 2–3 fold increase in alpha-satellite transcript levels for both the ASAT and SF1 smFISH probes (Figure 5F,G). The mean of 3 biological replicates was plotted and error bars represent the standard deviation. (F) Graph showing quantification CENP-A intensity in control and Ki67 stable knockout cells. Each point represents the average of the centromeres within a single cell. N = 15 cells/condition. Scale bars, 10 µm.
Figure 5—figure supplement 1—source data 1. Source data for the RT-qPCR experiments shown in Figure 5—figure supplement 1 – panel E.