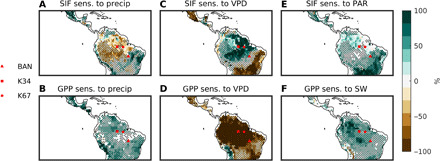
Fig. 2. ANN sensitivity analysis results: Wet season.

Remote sensing results for the sensitivity of SIF to precipitation (A), VPD (C), and PAR (E). Stippling represents areas of a median r > 0.6. Model results for the sensitivity of GPP to precipitation (B), VPD (D), and surface downwelling shortwave radiation (SW) (F). Stippling represents regions where at least 6 of the 10 CMIP5 models agree on the sign of the feedback depicted. Sensitivities represent the percent change in SIF due to a perturbation of each predictor variable by 1 SD. The locations of three flux towers used for further analysis are also shown.
