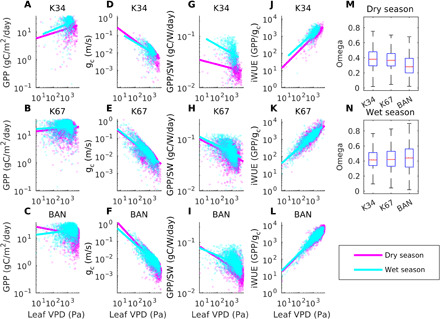
Fig. 3. VPD flux tower results.

Flux tower data from K34, K67, and BAN in Amazonia showing GPP versus VPD at the leaf surface (leaf VPD) (A to C), ecosystem conductance (gc) versus leaf VPD (D to F), GPP normalized by SW versus leaf VPD (G to I), GPP normalized by ecosystem conductance versus leaf VPD (J to L), and the decoupling coefficient between ecosystem conductance and transpiration, omega (M and N). Omega ranges from 0 (strong coupling) to 1 (no coupling). Hourly daytime data with no precipitation are used for varying time periods between 2002 and 2006 based on data availability.
