
Fig. 5. Measurement of miRNA, mRNA, and protein expression of EVs isolated from human plasma.
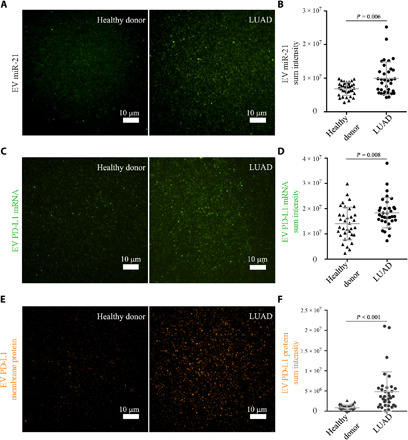
Samples were from 35 healthy donors and 34 patients with LUAD. (A and B) Representative images and statistical analysis of EV miR-21. (C and D) Representative images and statistical analysis of EV PD-L1 mRNA. (E and F) Representative images and statistical analysis of EV PD-L1 membrane protein. Note that in (F), P = 1 × 10⁻⁶; it is shown as P < 0.001 because only three decimal digits were shown.