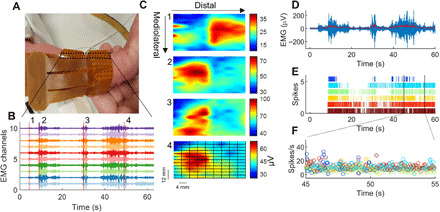
Fig. 2. High-density EMG activity and motor unit discharge times in neonates.

(A) Two grids of 64 electrodes (128 electrodes in total) covered most of the anterior lower leg of the neonates. The EMG grids were aligned with the direction of the tibia bone. The interelectrode distance was 4 mm. Photo credit: Alessandro Del Vecchio, Imperial College London. (B) Ten EMG channels showing common myoelectric activity during spontaneous movements. Vertical red lines indicate the time intervals when the RMS values were computed for each EMG channel. RMS was projected in 2D maps. (C) Four interpolated EMG-amplitude maps. The time windows correspond to the red lines in (B). These maps show distinct patterns of activation, resulting from activation of different muscles or distinct motor unit innervation zones. We then applied blind source separation on the EMG signals and identified the constituent motor unit action potentials. (D) Average EMG activity across all 128 channels with a 2-Hz low-pass filter (redline). (E) Raster plot of the discharges of six identified motor units. (F) The instantaneous discharge rate of these neurons displayed in a 10-s interval.
