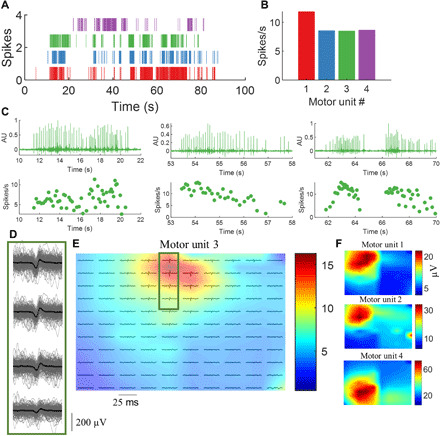
Fig. 3. Validity of blind source separation on high-density EMG signals.

(A) Raster plot of four identified motor units during neonatal spontaneous movements. (B) The average discharge rate for the neurons. (C) The output of the gradient convolution kernel compensation algorithm applied to the high-density EMG signals. We used the time instants identified by the algorithm to spike-trigger average the high-density EMG signals in 25-ms time intervals. (D) The spike-triggered average of the motor unit number #3 (green). The EMG channels in this example are displayed in monopolar derivation with each individual spike superimposed (black line denotes the average action potential). (E) The average motor unit action potential across the full duration of the trial for the 128 electrodes. The colormaps in (E) and (F) represent the RMS amplitude of the action potentials. Note that each motor unit has its unique territory. AU, arbitrary units.
