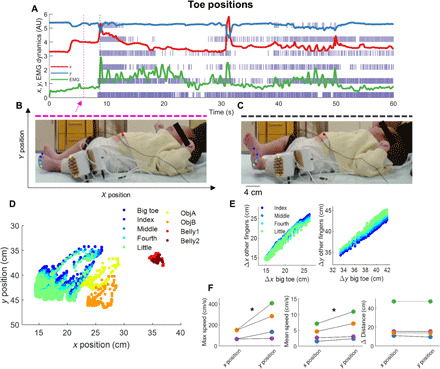
Fig. 5. 2D pose estimation of the neonates with EMG and motoneuron activity.

(A) The change in position of the big toe across the x (red) and y (blue) positions [as shown in (B)] is plotted as a function of time concurrently with the EMG signal (green line) and spike raster of the motor unit discharge timings. Note the synchronized activity between the neural stimuli and movements. The movements of the neonates are shown for two representative images corresponding to the dotted magenta and black lines, respectively, in (B) and (C). Photo credit: Alessandro Del Vecchio, Imperial College London. We tracked the positions of nine markers corresponding to the five toes, two EMG connectors, and two locations on the neonate belly as shown in (D). (E) Bivariate correlations between the finger positions (R > 0.9 for all cases, P < 0.0001). (F) The maximum speed, mean speed, and average distance covered by the fingers of the neonates are shown. *P < 0.0001.
