Figure 6.
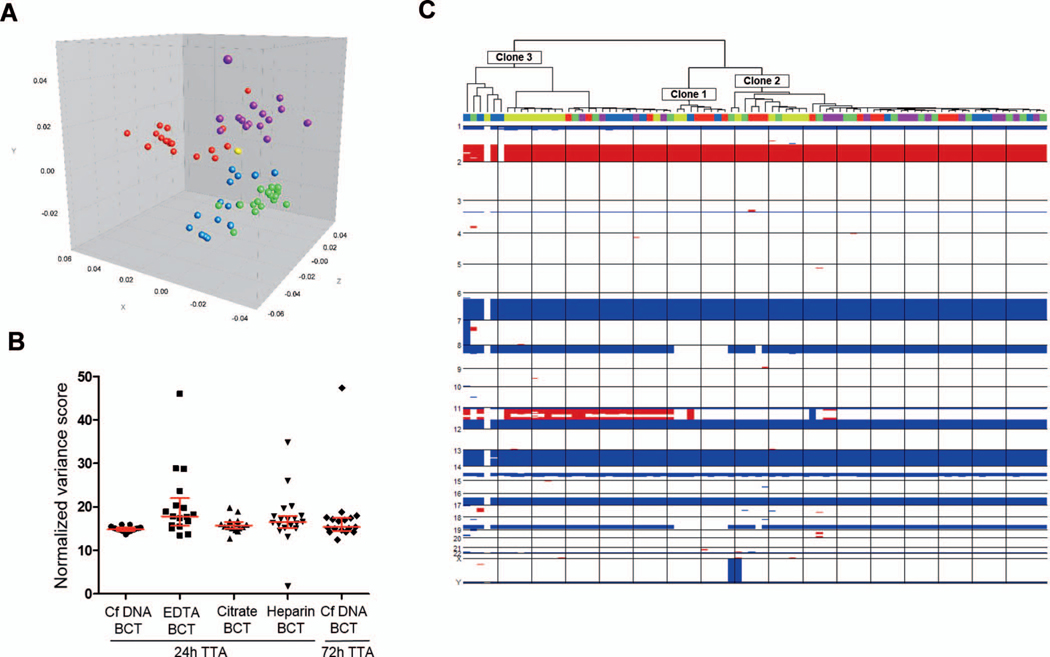
Single-cell genomics. A, Three-dimensional multidimensional scaling analysis conducted on the whole-genome amplification (WGA) profiles composite data set: yellow= cell-free DNA (CfDNA) blood collection tube (BCT), 24 hours (17); blue= EDTA BCT, 24 hours (17); purple=citrate BCT, 24 hours (16); green=heparin BCT, 24 hours (19); red= CfDNA BCT, 72 hours (17). Dimensions x, y, and z are arbitrary scales that represent the first, second, and third components defined by the method to compare distances between entries of the similarity matrix. Less distance indicates higher level of similarity. B, Variance of copy number variation (CNV) profiles (n= 86). The noise associated with the copy number profiles was calculated for each cell picked and amplified from each of the 5 conditions under comparison as the variance of the ratio of the normalized bin counts in each bin divided by the mean ratio for the genome segment called by DNAcopy as defined in Materials and Methods. Kruskal-Wallis test and Dunn multiple comparison tests were used to compare variance scores (P =.001). Median and interquartile range are indicated. C, Three different clonal lineages, represented as clones 1, 2, and 3, were identified by comparison of single-cell CNV profiles in an unsupervised hierarchical clustering (n= 86). The BCT and time-to-analysis (TTA) from which each cell was isolated is indicated with colors as in (A).

