
Fig. 3.
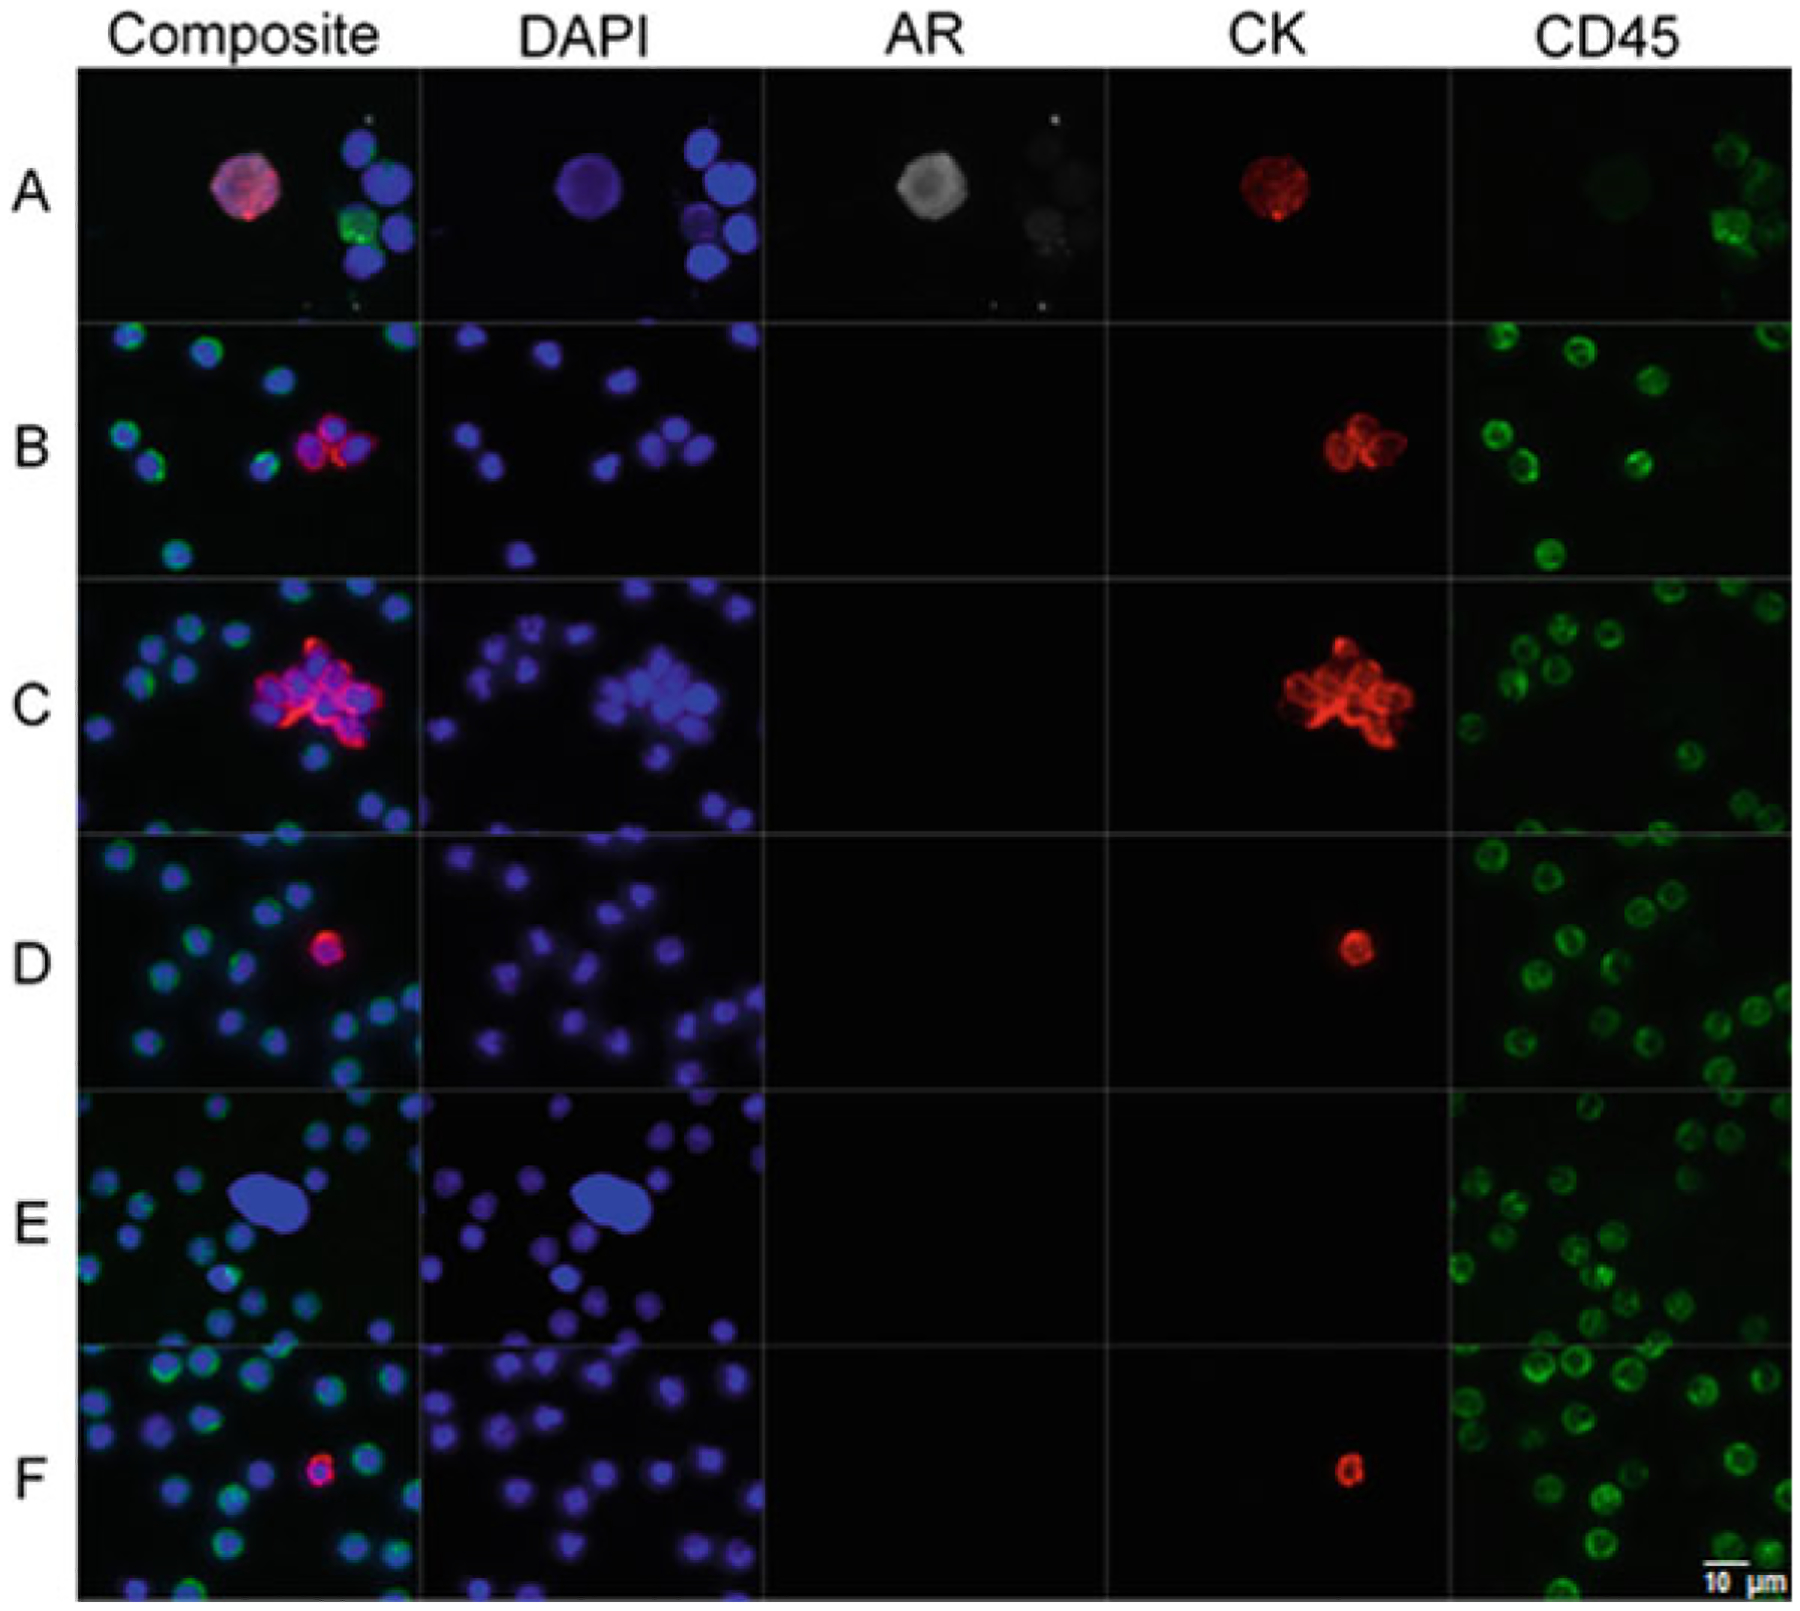
Gallery of representative CTCs detected in the blood of a patient with prostate cancer. Panel A shows a composite image and individual optical channels of an HD-CTC. In addition, this particular tumor cell expresses androgen receptor (AR). HD-CTCs are defined by having an intact nucleus, identified through DAPI (blue); being of epithelial origin, characterized by a bright cytokeratin (red) stain; no CD45 signal (green)—a leukocyte marker; and a distinct morphology. Panel B represents a CTM triplet. Panel C represents a mega-CTM (>5 CTCs). Panel D represents a CTC-small. Panel E represents CTC-low CK. Panel F represents CTC-cfDNA producing. Scale bar = 10 μm