Figure 7.

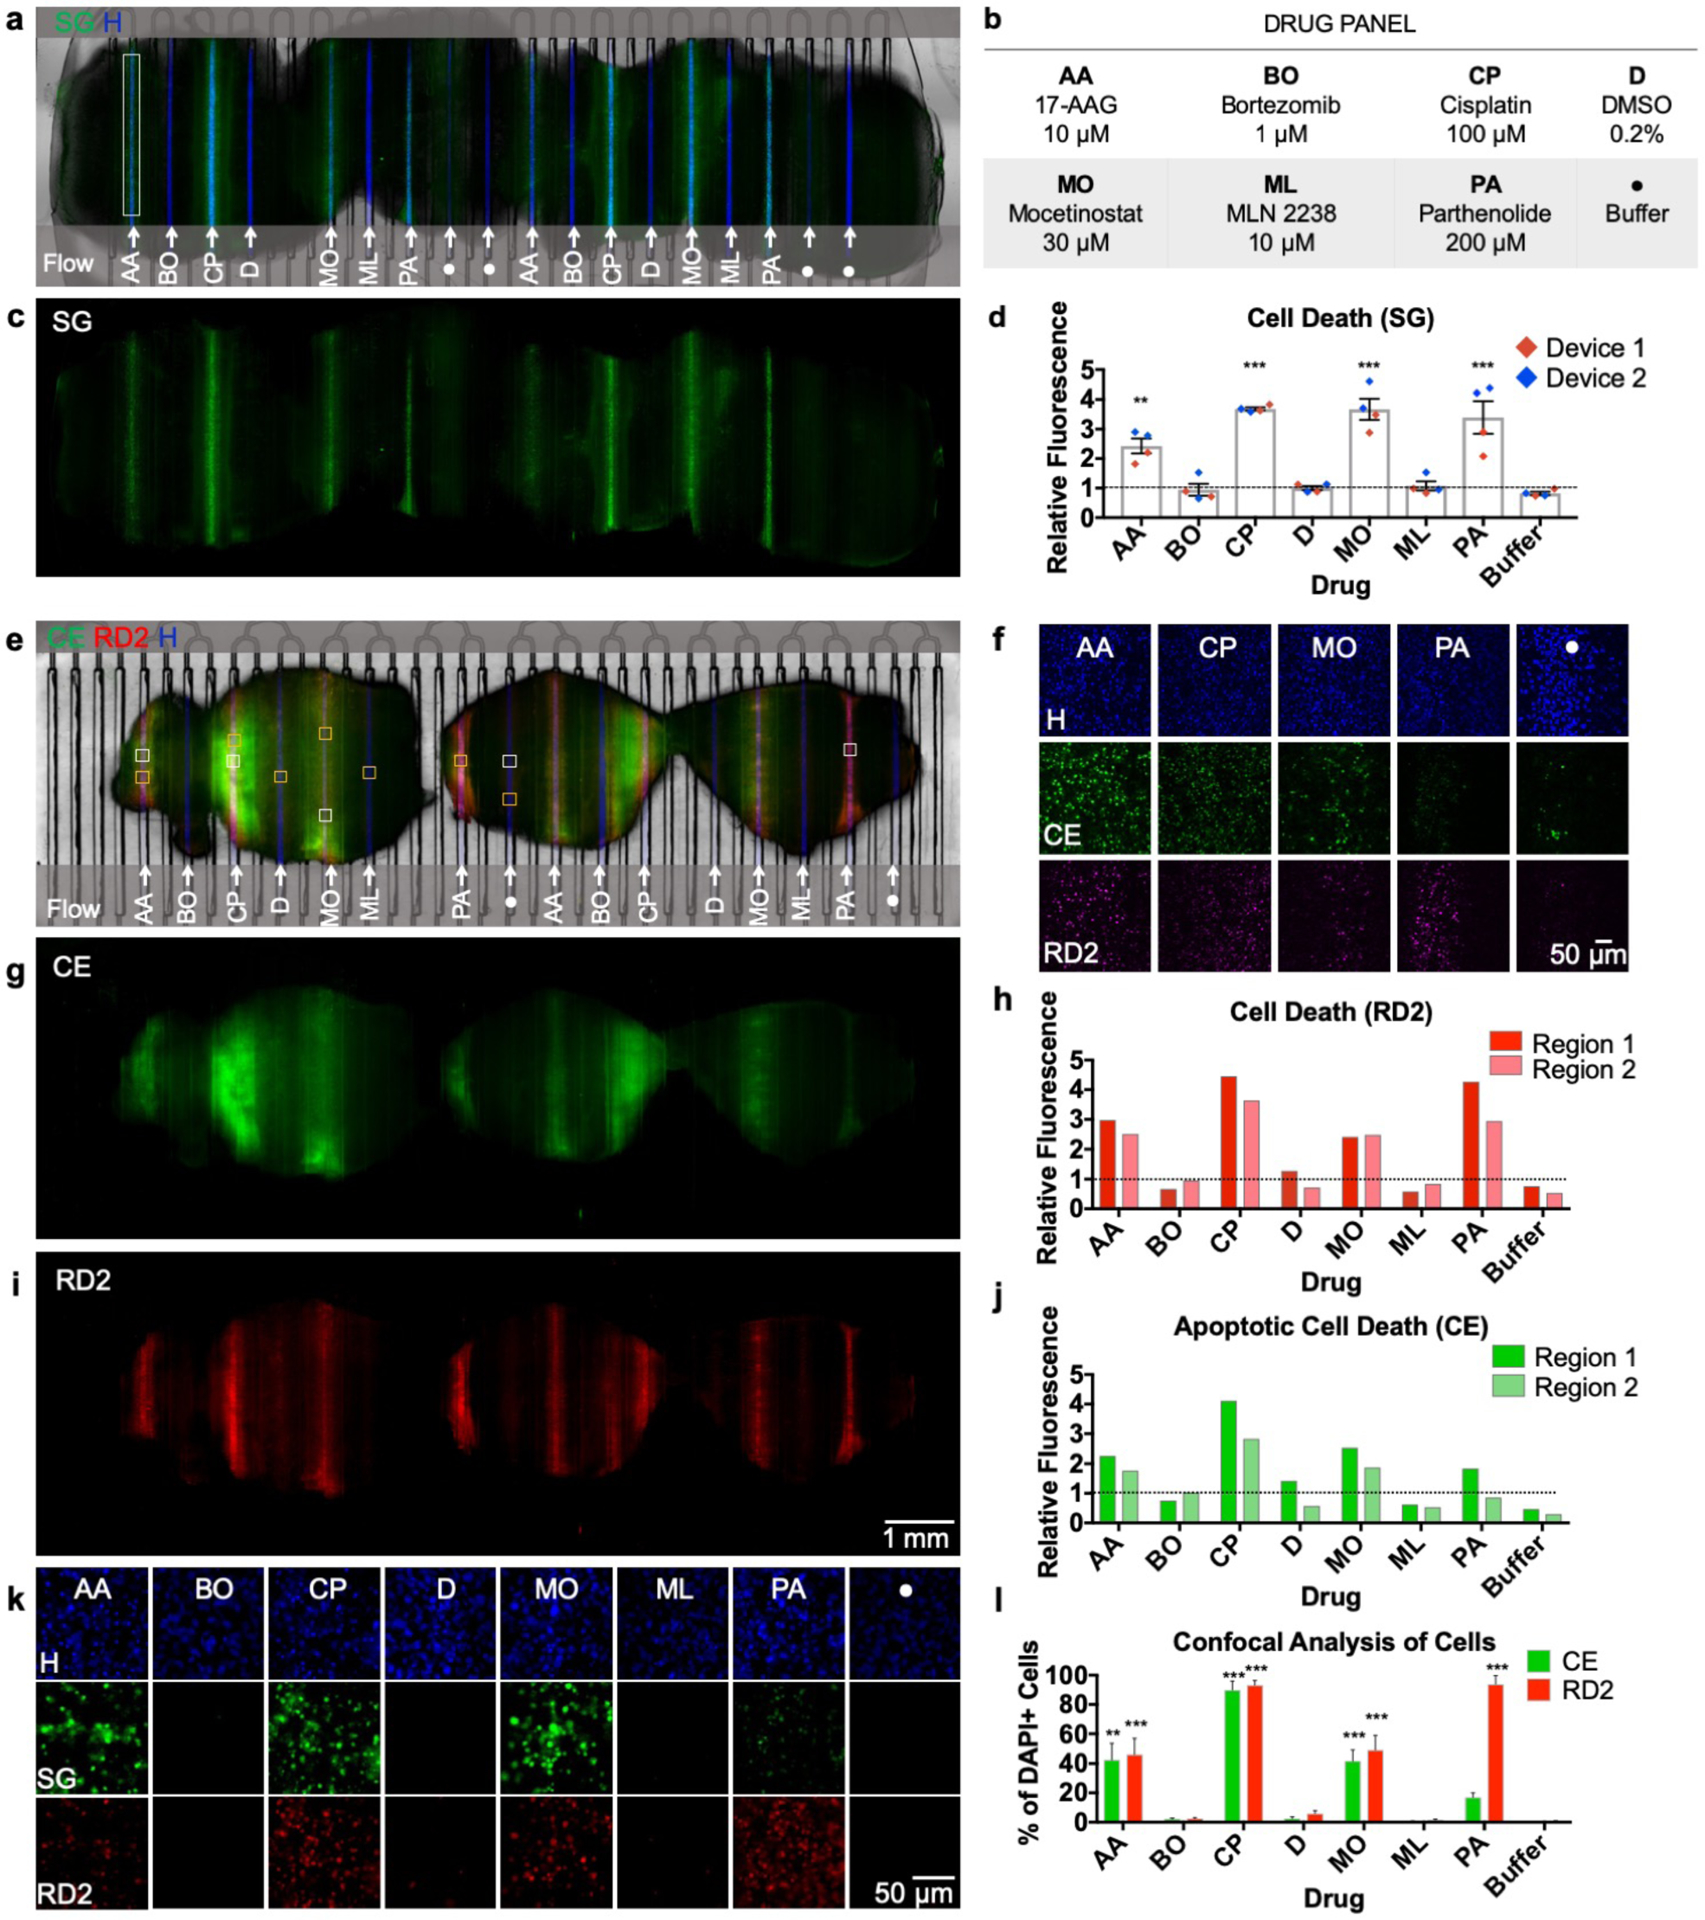
Multiplexed drug exposure of U87 GBM xenograft flank tumor slices. a) On-device micrograph of U87 flank xenograft slices (3) after 48-hour drug exposure showing selective delivery and response to 8 different conditions (b). Hoechst nuclear dye (blue) denotes areas of delivery and Sytox Green areas of cellular death (c). d) Drug response measured by relative fluorescence (to DMSO) obtained from two different devices ran in parallel. e) On-device micrograph of U87 flank xenograft slices (3) after 48-hour drug exposure, labeled with Cell Event (green, g) and RedDot 2 (red, i). f) Confocal micrographs (20×) of drugs showing response compared to a negative control (samples taken from white boxes in (e)). h) Apoptotic response shown by Cell Event from two different tissue regions (dotted line = DMSO vehicle control baseline). j) Necrotic and late apoptotic areas shown by RedDot 2 from two different tissue regions (dotted line = DMSO vehicle control baseline). k) 20× fluorescent micrographs for each condition (yellow boxes in (e)). l) Cell Profiler cellular analysis showing % of DAPI+ cells positive for Cell Event/RedDot 2. n = 11 (AA), 5(BO & CP), 8(D & ML), 7(MO & Buffer), 6 (PA). Ave ± SEM. One-way ANOVA versus DMSO with Dunnett’s multiple comparison test. *p<0.05, **p<0.01, ***p<0.001. Abbreviations: CE (Cell Event), SG (Sytox Green), RD2 (RedDot 2), H (Hoechst).
