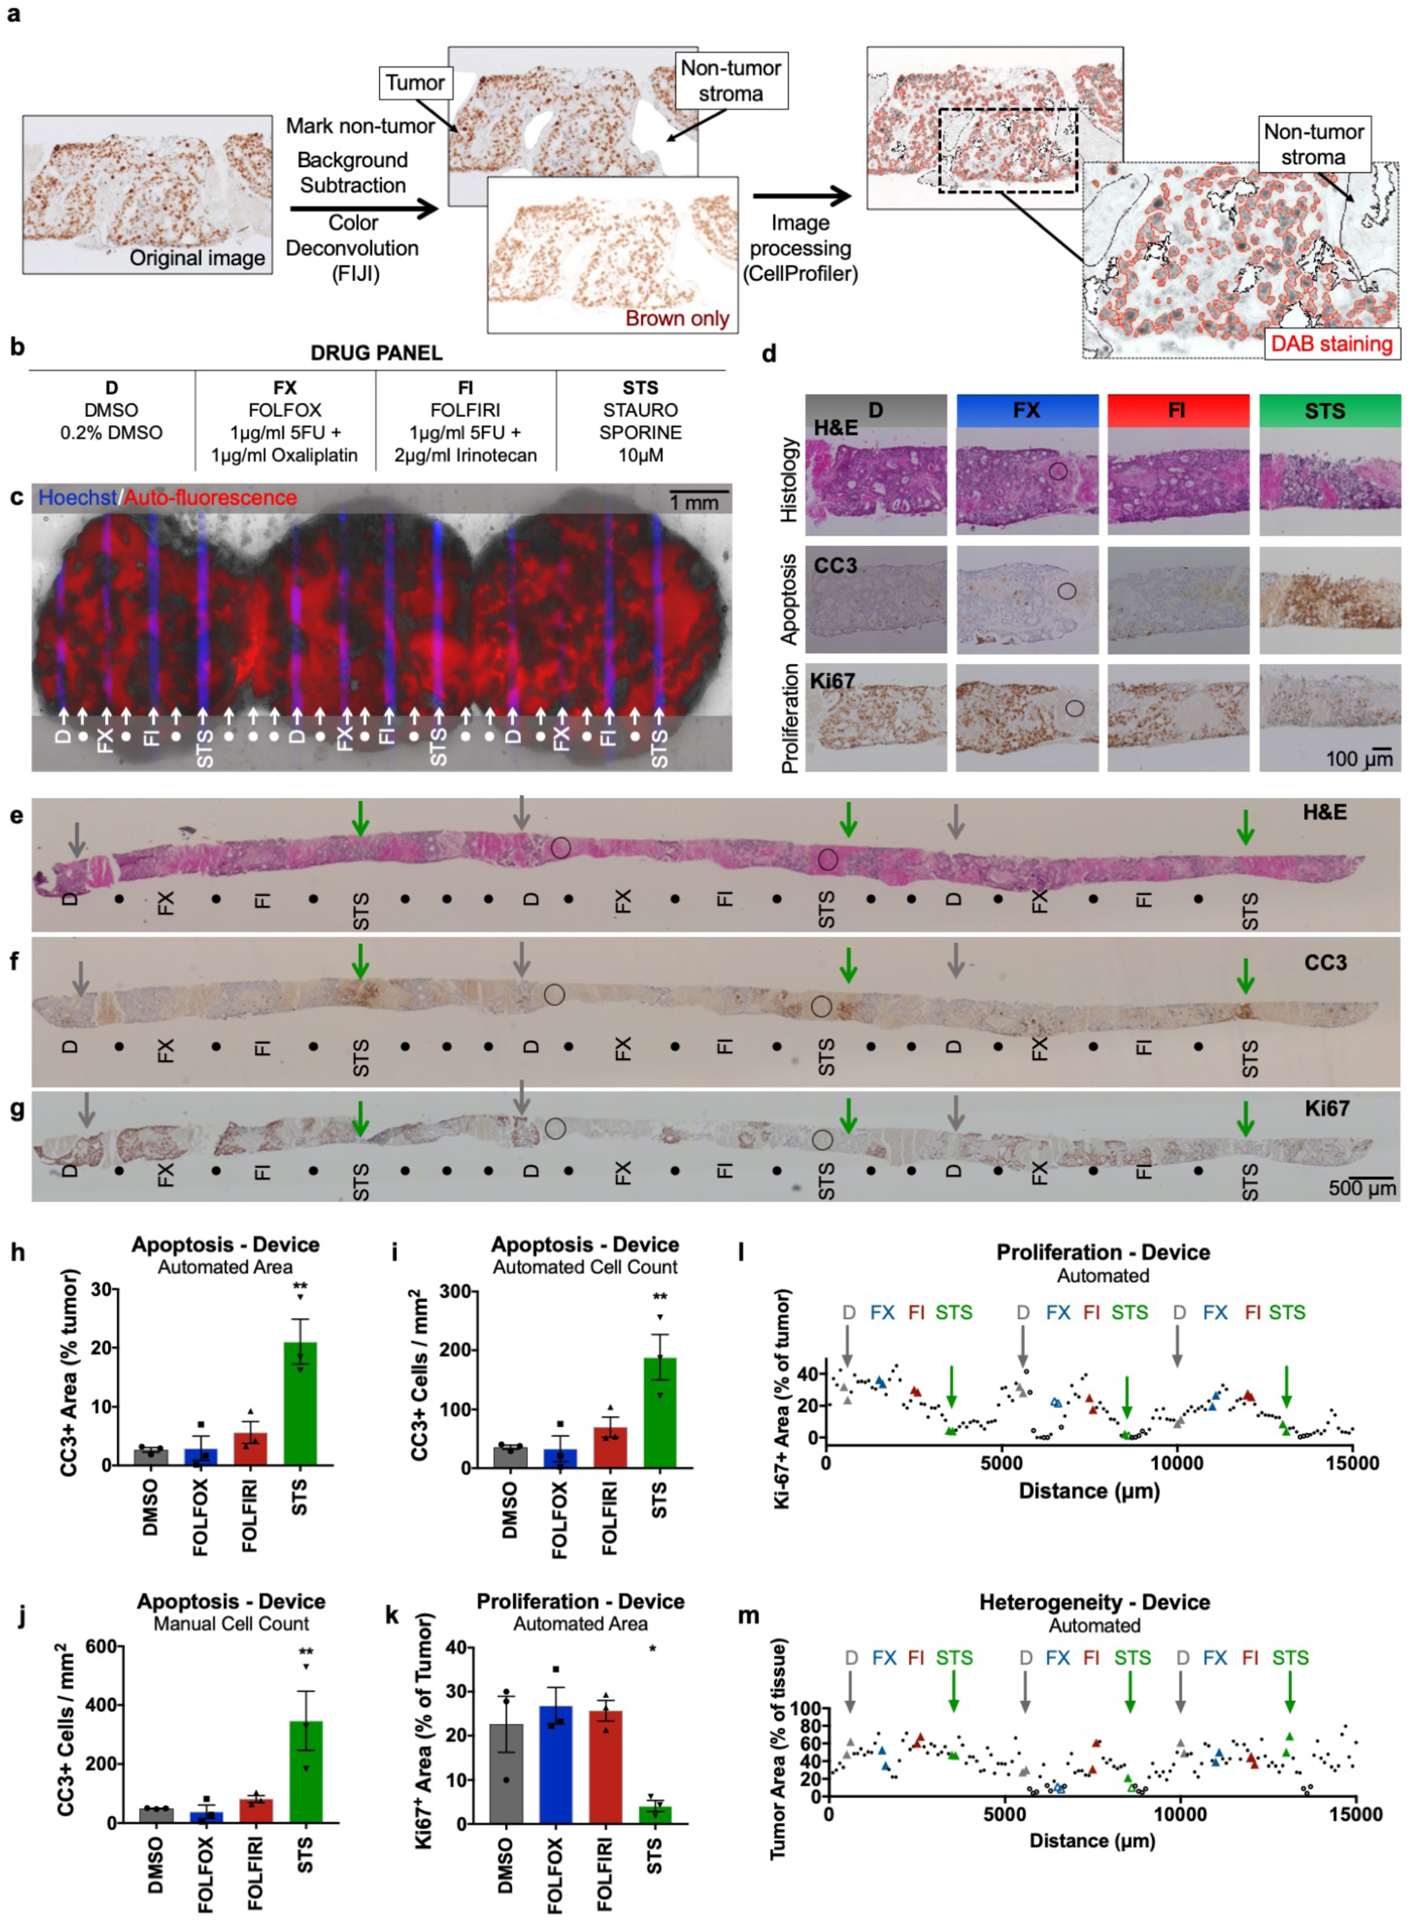
Figure 8.

Semi-automated analysis of patient-derived liver metastasis slices from colorectal cancer (CRC) following drug exposure. Apoptosis and proliferation were quantified using immunostained metastasis slices derived from a prior experiment.41 (a) Workflow for image analysis of brown DAB immunohistochemical staining of tissue sections by the FIJI program followed by a custom CellProfiler routine. (b) Drug panel including vehicle control (DMSO), de Gramont protocol (FOLFOX & FOLFIRI), and staurosporine (STS). (c) CRC tumor slices after drug exposure for 2 days (off-device controls for 3 days), showing selective delivery and response to 4 different conditions (n=3 for each, labeled with Hoechst) with alternating buffer (●). Prior analysis of CellEvent live fluorescent staining of these slices demonstrated apoptosis following STS treatment41. (d-g) Staining of perpendicular tissue sections from the bottom halves of the CRC slices (c) shows H&E appearance and identifies apoptosis (CC3) or cell proliferation (Ki-67) for each treatment. (d) Representative 20× micrographs of drug delivery areas. (e-g) Low power micrographs of perpendicular sections show indicated locations of drug delivery channels as inferred from Hoechst staining of adjacent sections. DMSO control (D, grey arrows), STS (green arrows), and non-analyzable stromal areas (circles) are indicated for orientation. These images of CC3 and H&E staining in perpendicular sections resemble the images of staining previously seen in parallel sections taken from the top halves of the same CRC slices in Horowitz et al. Fig. 7.41 (h-j) Apoptosis after drug treatment based on automated area analysis (h, % of tumor), automated cell count (i, CC3+ cells/mm2 total area), or manual cell count (j, CC3+ cells/ mm2 total area) of images that largely exclude stromal (non-tumor) regions. (k,l) Proliferation after drug treatment, based on automated area analysis (% of tumor). Images were subdivided into 100-μm-wide regions for analysis along the entire tissue (l), and drug treatment locations were analyzed over a 200-μm-wide area for (k). (m) Heterogeneity of tumor area as % of total tissue, averaged from all images analyzed for each 100-μm-wide region. n=3 locations per condition, with 6 sections (>100-μm apart) analyzed per location. Ave ± SEM. One-way ANOVA versus DMSO with Dunnett’s multiple comparison test. *p<0.05, **p<0.01, ***p<0.001. Abbreviations: DAB (diaminobenzidine), HPF (high-power field).
