
Figure 2.
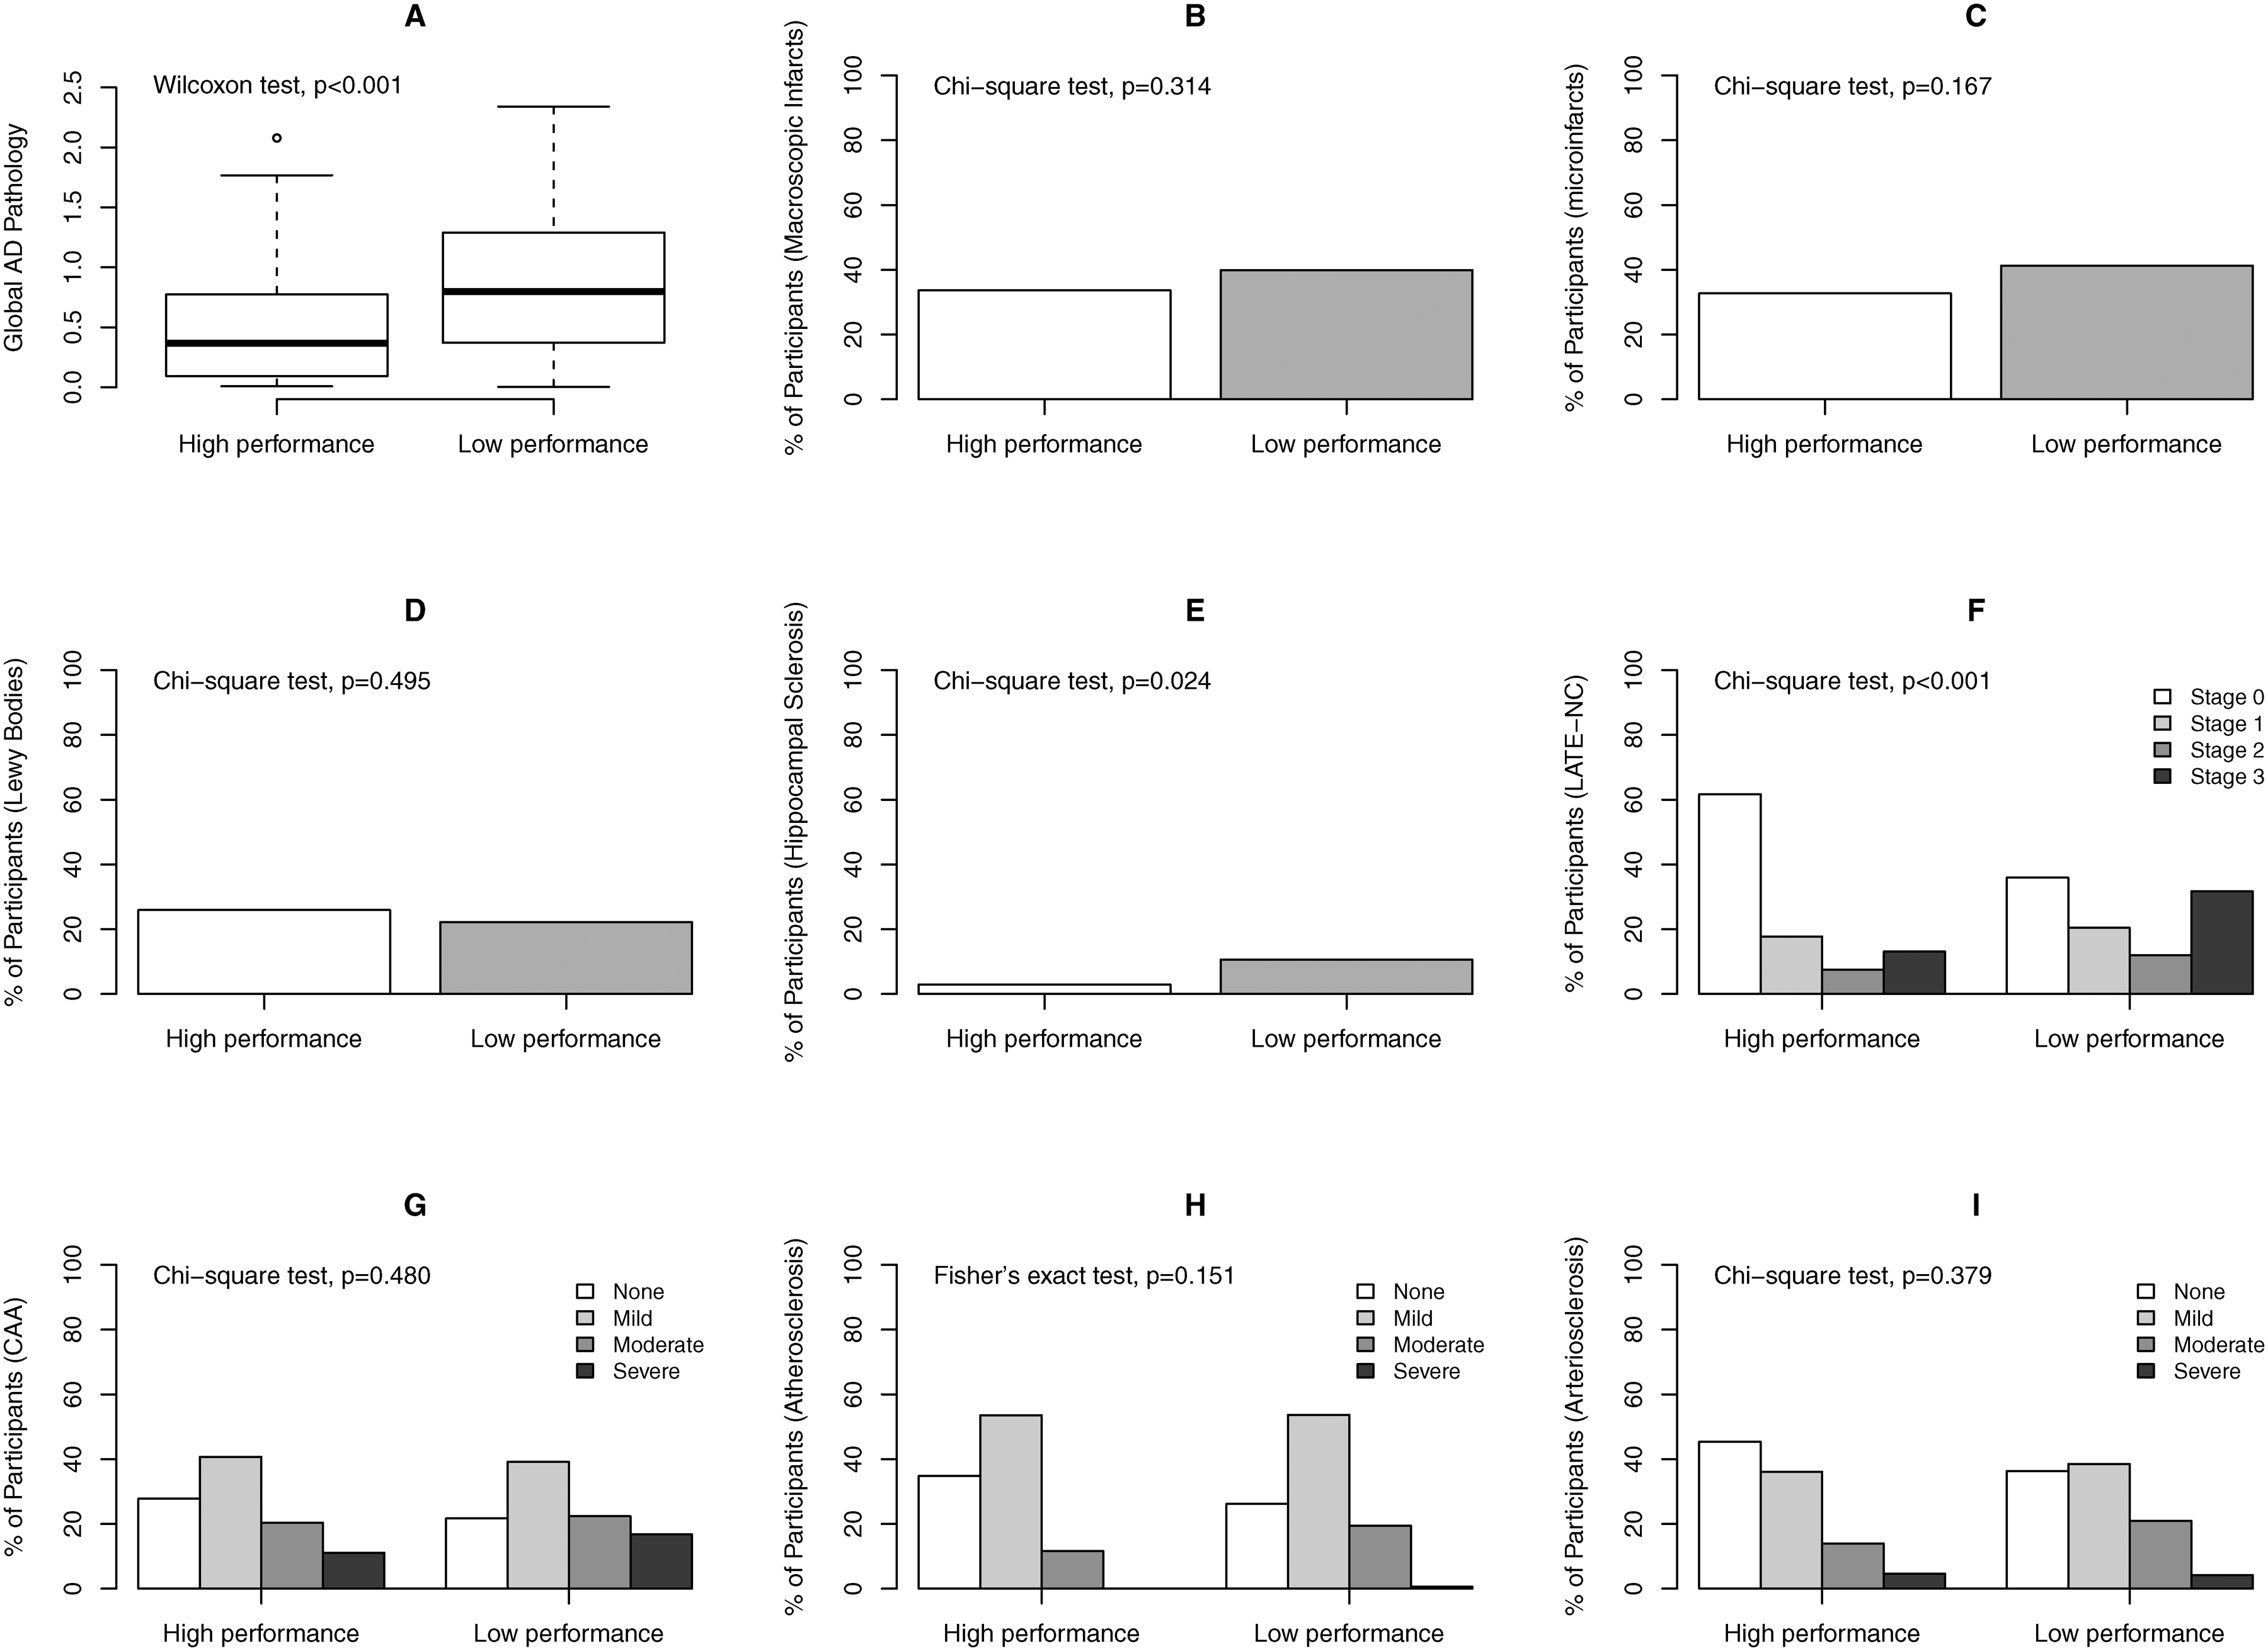
Burdens of common neuropathologies by literacy performance groups. The figure shows distributions of common neuropathologic indices between the groups of high and low literacy performance. Panel A: boxplot for global burden of AD pathology; Panel B through Panel I: bar charts for percent participants with chronic macroscopic infarcts (B), chronic microinfarcts (C), neocortical Lewy bodies (D), hippocampal sclerosis (E), LATE-NC (F), amyloid angiopathy (G), atherosclerosis (H) and arteriolosclerosis (I). Wilcoxon rank-sum test, Chi-square test or Fisher’s exact test compared the unadjusted group difference for each neuropathologic index.