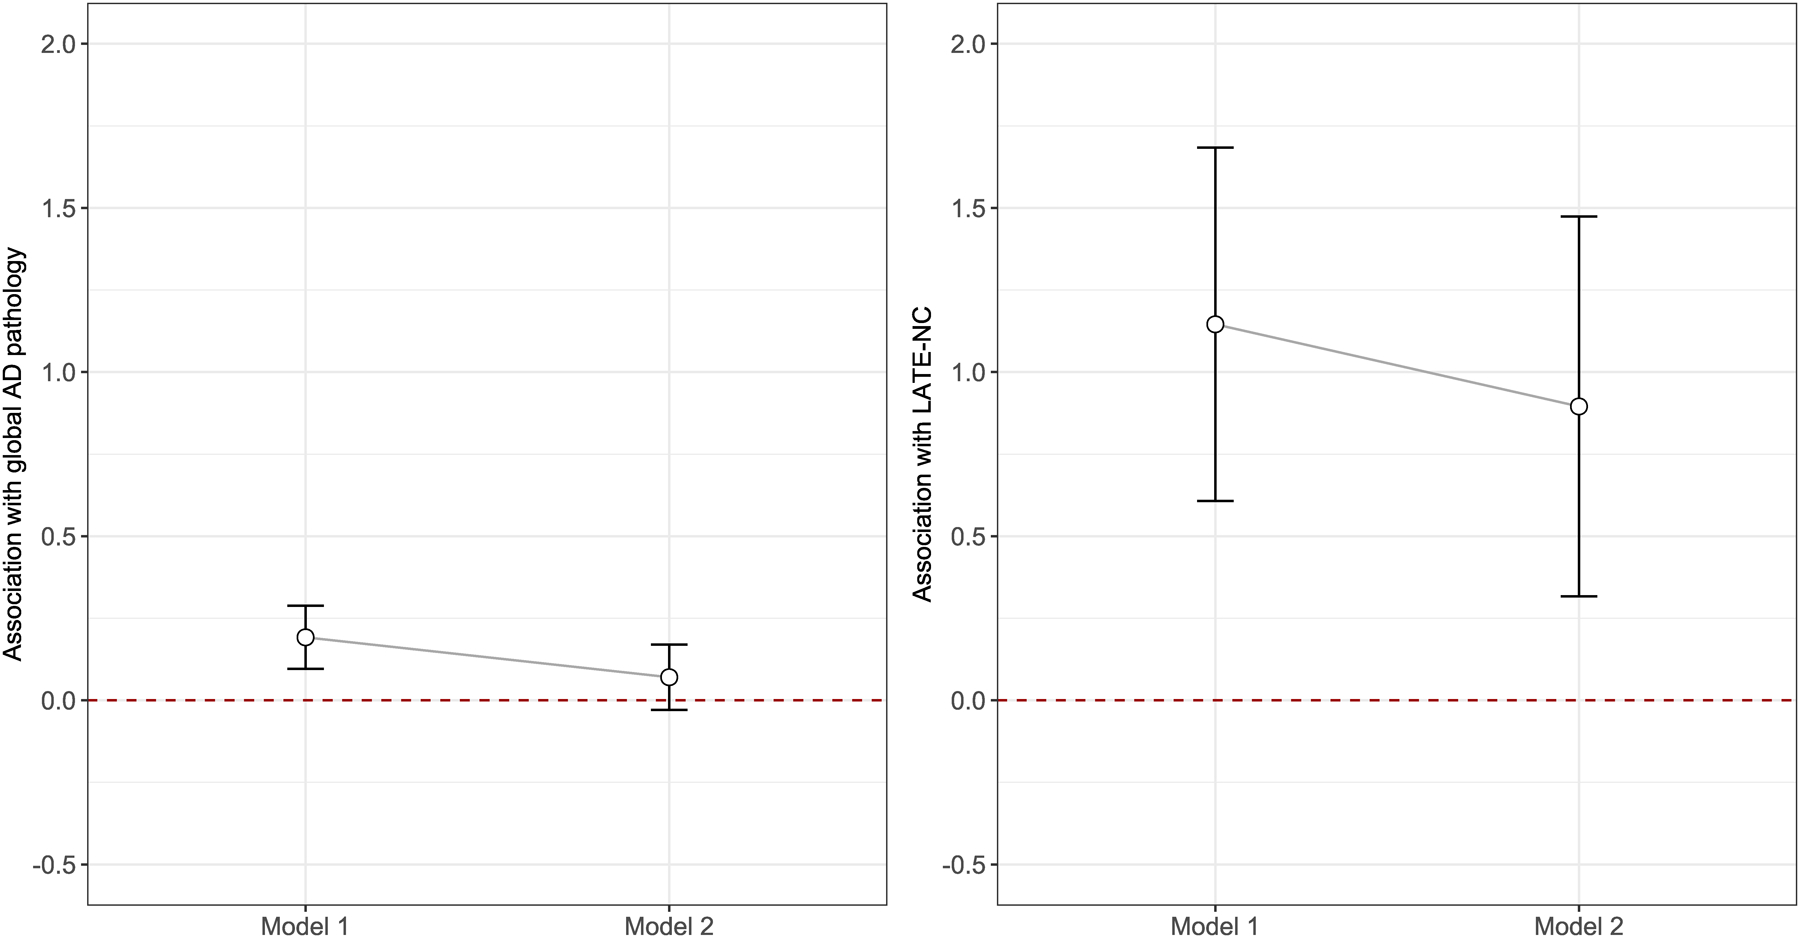
Figure 3.

Difference in burdens of AD and LATE-NC by literacy performance groups. The figure illustrates the difference in burdens of AD (left panel) and LATE-NC (right panel) by literacy performance groups in the models without (Model 1) and with (Model 2) the adjustment for cognition. The point estimate (regression coefficient for AD model, and log odd ratio for LATE-NC model), shown as open circle, corresponds to the additional burden of each pathology for the low literacy performance group. The error bar is calculated using +/− 1.96 times corresponding standard errors.
