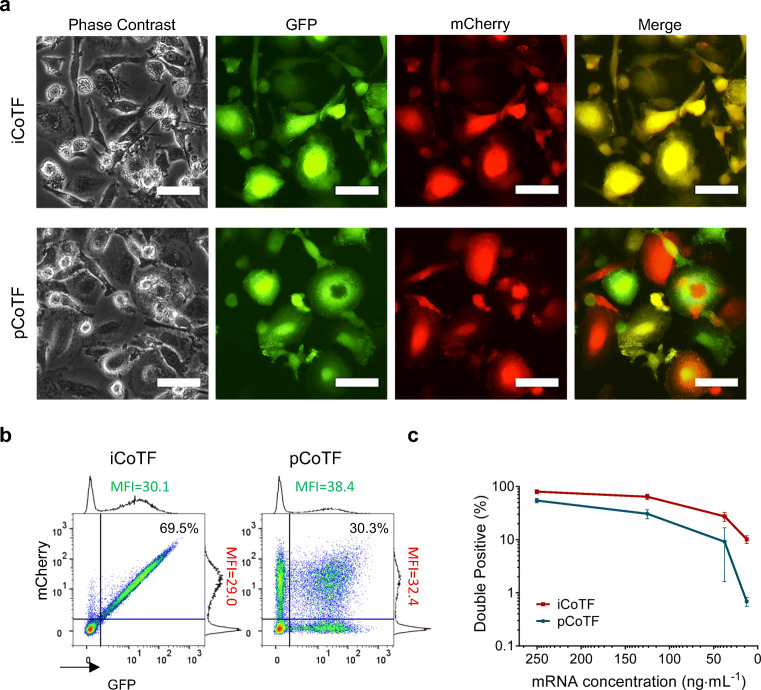
Fig. 3.
Simultaneous transfection of macrophages with EGFP and mCherry coding IVT-mRNA with two different strategies. Fluorescent microscopy images (bar = 50 μm) a and flow cytometric density plots b depicting the fraction of double-positive cells in integrated versus parallel co-transfected macrophages for an mRNA dose of 125 ng mL−1. Analogous measurements were performed for cells transfected with various mRNA doses c. All experiments were performed using a liposomal carrier (LipoMM); multiple comparison t test revealed significant difference between iCoTF and pCoTF for all evaluated mRNA doses (p < 0.05). No fluorescent signal-/double-positive event was observed for untransfected macrophages. Values are presented as mean ± SD, n ≥ 3. Error bars indicate SD. (iCoTF, integrated co-transfection; pCoTF, parallel co-transfection)

