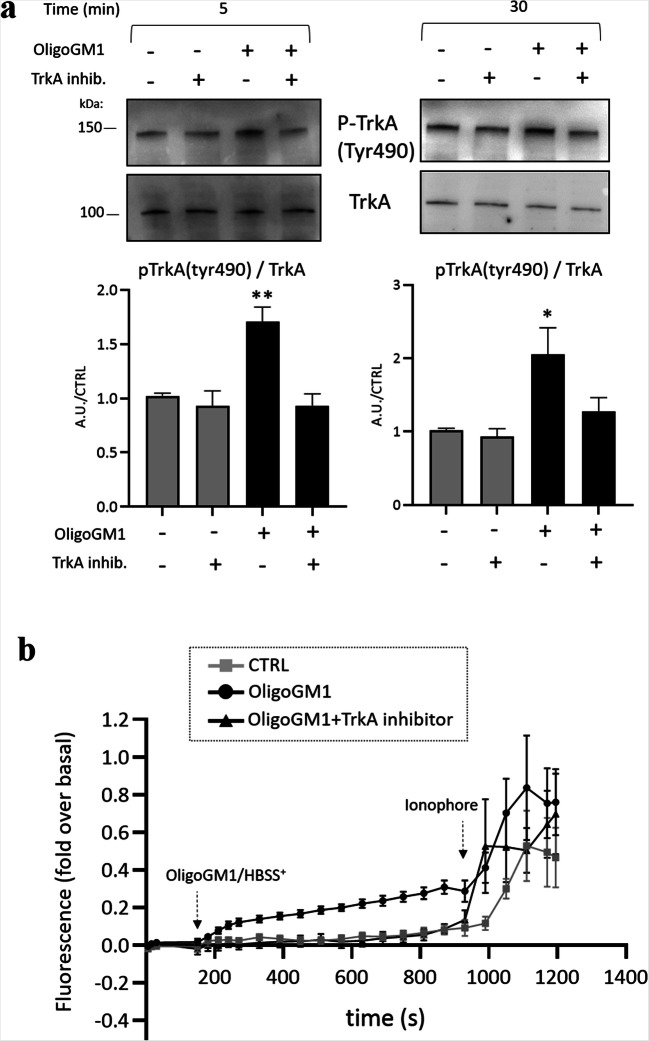
Fig. 3.
OligoGM1-mediated Ca2+ modulation depends on TrkA activation. a The TrkA receptor inhibitor (120 nM) was added to the N2a cells 1 h before the administration of 50 µM OligoGM1. Expression of TrkA and p-TrkA (tyrosine 490, Tyr490) was evaluated 5 and 30 min after OligoGM1 treatment by western blot using specific antibodies and revealed by enhanced chemiluminescence. Top: immunoblotting images are shown. Bottom: semiquantitative analysis of p-TrkA related to total level of TrkA. Data are expressed as fold increase over control of the mean ± SEM from three different experiments (*p < 0.05, **p < 0.01, two-way ANOVA, n = 3); b Intracellular Ca2+ level of N2a cells treated with OligoGM1 was analyzed measuring the green fluorescent emission of 2.5 µM Fluo-4. The frames were acquired every 5 sec for 20 min with Widefields Zeiss Axio Observer.Z1 with a 400X magnification. The TrkA inhibitor (120 nM) was added to the culture medium for 30 min before Fluo-4 administration and left for the duration of the experiment. After 3 min of basal acquisition, 50 µM OligoGM1 was administered to the cells and after 15 min the calcium ionophore A23187 (2 µM) was added. Control cells were loaded with HBSS+ alone. Only ionophore responsive cells were analyzed. The fluorescence of each frame (Fx) was related to the fluorescence of the basal condition (F0) (Fx-F0/F0). Results are expressed as the mean ± SEM of fluorescence intensity of at least three independent experiments (OligoGM1 * p < 0.05 vs. basal, one-way ANOVA, n = 11; OligoGM1 **p < 0.01 vs. CTRL, two-way ANOVA; OligoGM1 + TrkA inhibitor NS vs. basal, one-way ANOVA, n = 5; OligoGM1 + TrkA inhibitor NS vs. CTRL, two-way ANOVA)

