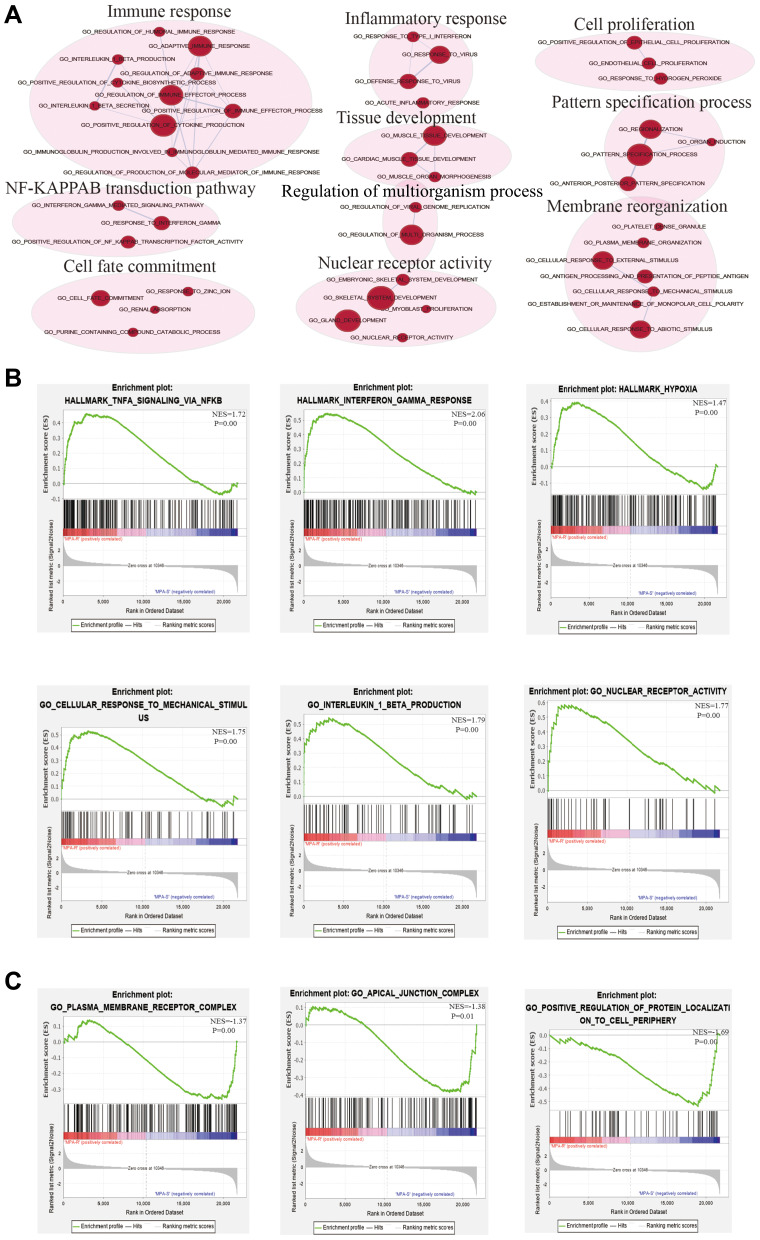
Figure 2.
The results of GSEA analysis. (A) The pathway network of the group. The red dots represent upregulated pathways. (B) Significantly enriched gene sets in IshikawaPR cell line. (C) Significantly enriched gene sets in Ishikawa cell line. MPA-R represents cell line of IshikawaPR; MPA-S represents cell line of Ishikawa; NES, normalized enrichment score.

