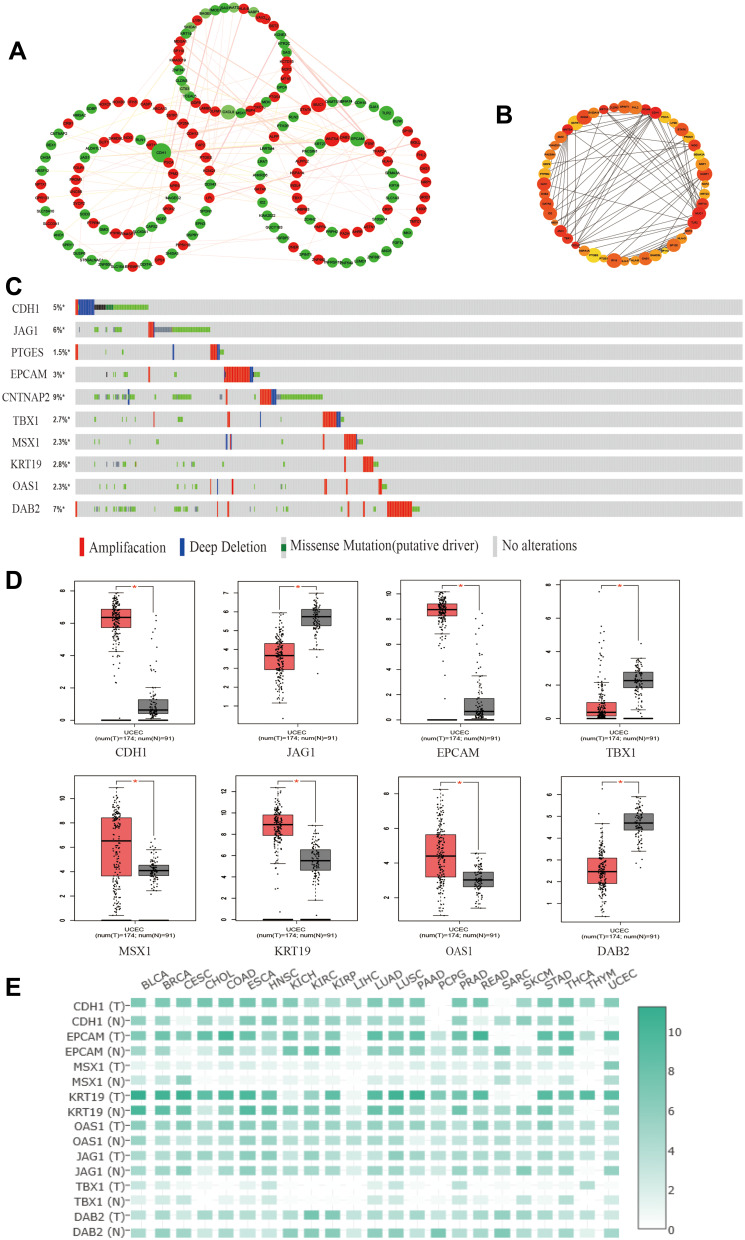
Figure 3.
Identification and verification of hub genes in datasets. (A) The PPI network of top 250 DEGs. (B) The construction of submodule by the plug-in of CytoHubba in Cytoscape. (C) The OncoPrint tab showed a visual summary of the different alterations of 10 hub genes by the website of cBioPortal. (D) The protein expression of hub genes in GEPIA. *P<0.05 compared with normal endometrial tissues. (E) The expression heatmap of 10 hub genes in human cancers.

