Figure 4.
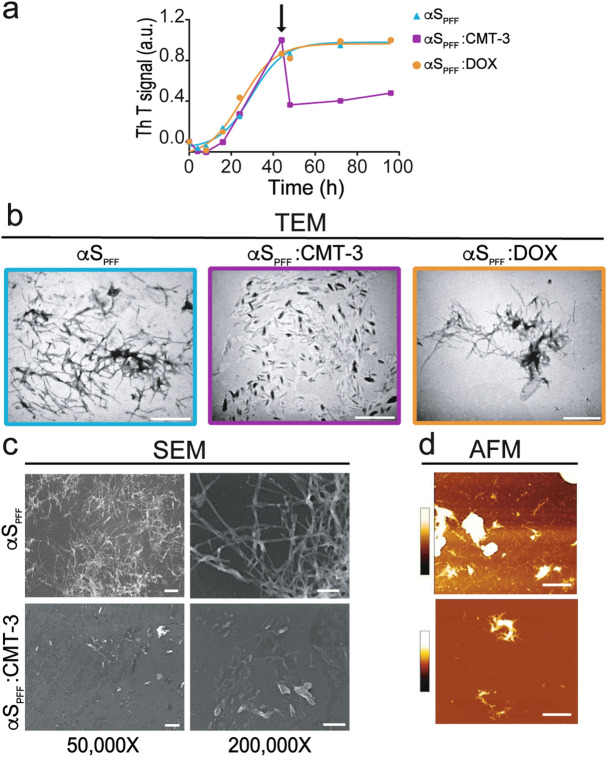
CMT-3, unlike DOX, disassembles preformed α-synuclein amyloid fibrils (αSPFF). (a) In ThT fluorescence assays, 70 μM α-synuclein was either incubated alone (blue line), or with 100 μM of CMT-3 (purple line) or DOX (orange line) added 44 h after the initiation of the aggregation process (arrow). (b) TEM of α-synuclein samples incubated at 37 °C under orbital agitation during 44 h to obtain fibrillar species (αSPFF). Samples were further incubated for another 52 h either alone or with the addition of 100 μM CMT-3 or DOX. Note the dramatic reduction in αSPFF with the addition of CMT-3, but not with DOX. The scale bar corresponds to 1 μm (×26,000). (c, d) αSPFF and αSPFF:CMT-3 species from (b) were further submitted to SEM and AFM. SEM scale bar corresponds to 500 nm (×50,000) and 200 nm (×200,000). AFM scale bar corresponds to 1 μm. The pseudo color scale bar represents the information of the z axis from 0 to 100 nm. The z range was chosen to allow the observation of fibrils while the aggregated fibrillar clusters are out of range since they have a height greater than 100 nm.

