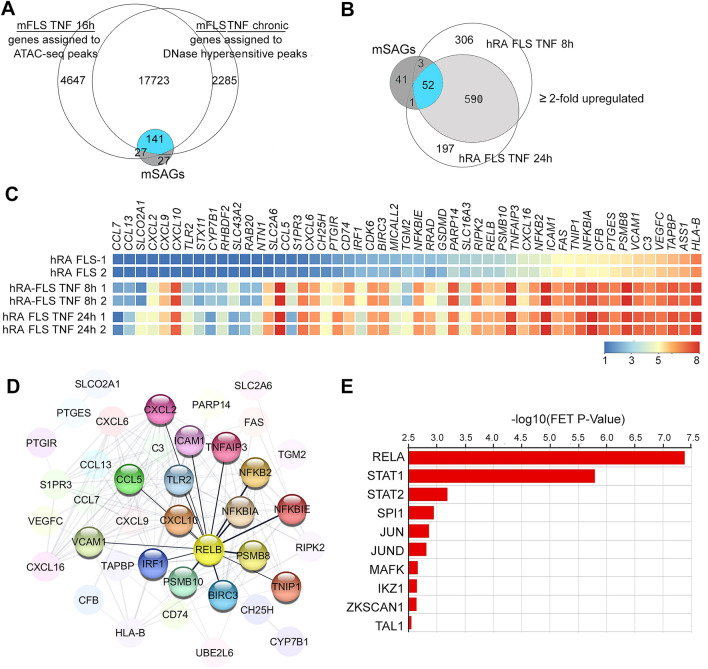
Figure 3.
SAGs regulate pro-inflammatory signaling networks in mouse and human FLS. (A) Venn diagram showing the overlap between genes assigned to ATAC-seq and DNase-seq peaks in short-term (16 h) and chronic-TNF conditions with that of mSAGs identified from Fig. 1A. Overlapping SAGs are shown in blue. (B) Venn-diagram showing the overlap between gene upregulated by > twofold in human RA-FLS treated with 10 ng/mL recombinant TNF for 8 h and 24 h with that of 141 mSAGs identified in Fig. 3A. 52 overlapping human SAGs are shown in blue. (C) Heatmap of hSAGs. Each box represents one gene and is color-coded based on normalized expression levels. (D) Functional protein–protein interaction between hSAGs by STRING analysis. Proteins interacted with RELB are highlighted. (E) Top 10 transcriptional factors predicted to regulate hSAGs expression identified by ChEA3 online tool.

