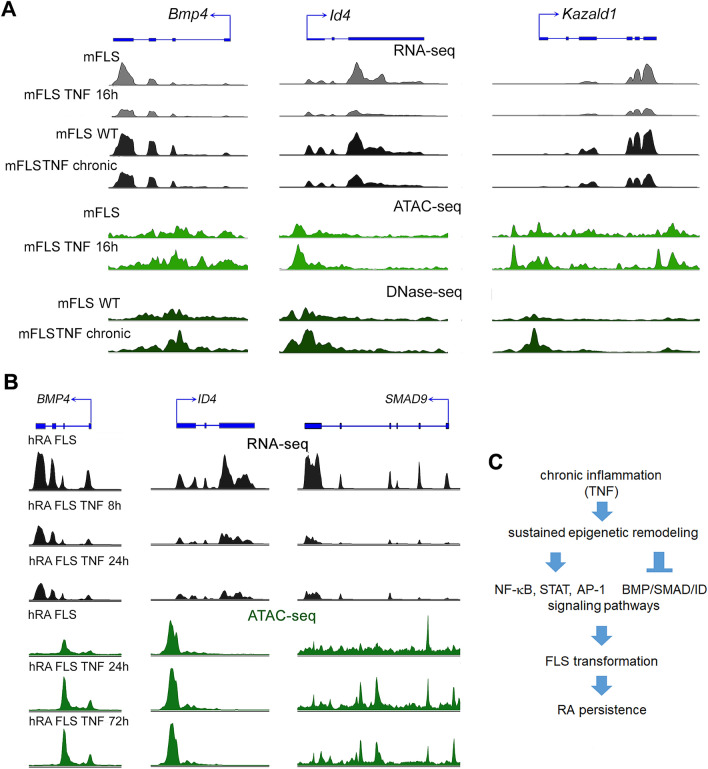
Figure 6.
Transcriptomic and chromatin accessibility profile changes at mouse and human SAGs. (A) RNA-seq, ATAC-seq and DNase-seq peak profiles in mFLS for the indicated conditions at Bmp4, Id4 and Kazald1 genomic loci. (B) RNA-seq and ATAC-seq peak profiles in hRA-FLS for the indicated conditions at BMP4, ID4 and SMAD9 genomic loci. (C) Schematic showing persistent and long-term reprogramming of signaling pathways in FLS exposed to chronic TNF exposure.

