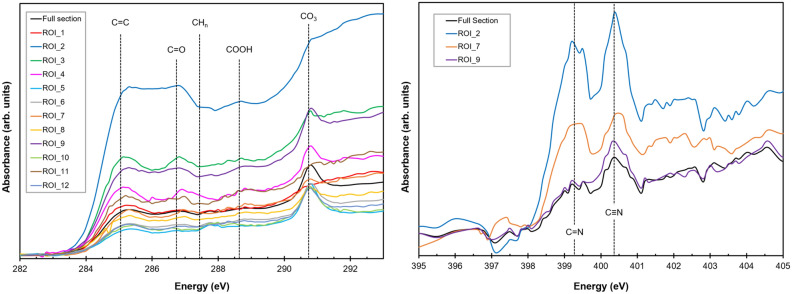
Figure 5.
STXM spectra obtained from both all the pixels and specific regions of interest (ROI) within the FIB lamella (see also Fig. S1). Left: Spectra obtained at the C-K edge giving similar results as the EEL spectra, but with a high signal-to-noise ratio and more spectral detail. See text for details of detected bands. Right: N-K edge spectra on these organics showing the two dominant bands due to imine/nitrile C-N bonding environments.

