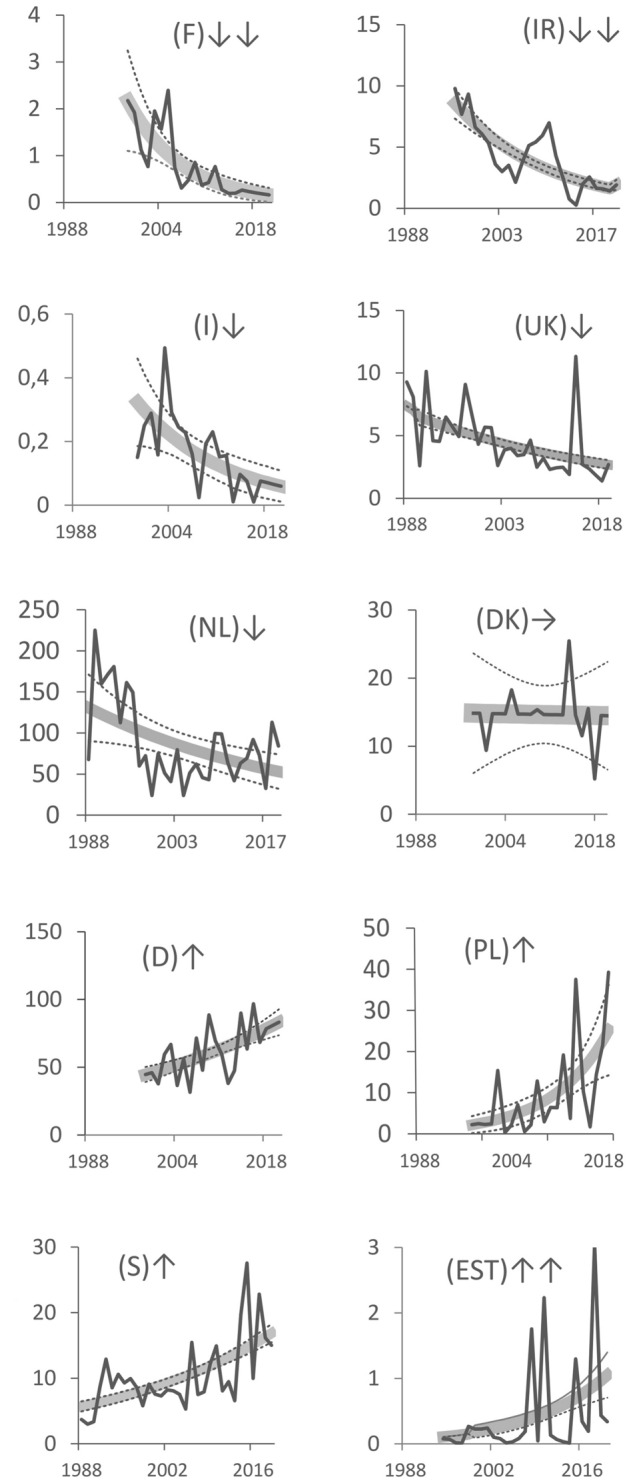
Figure 3.

Trends in abundance of Greater Scaup Aythya marila in ten countries within the wintering range fitted for data from the year 1988–2019. France (F), Ireland—whole island (IR), Italy (I), The United Kingdom—without Northern Ireland (UK), The Netherlands (NL), Denmark (DK), Germany (D), Poland (PL), Sweden (S) and Estonia (EST). Gray thick line—modelled trend, dotted lines—95% confidence intervals, black line—imputed values. ↓↓—steep decline, ↓—moderate decline, → —stable, ↑—moderate increase, ↑↑—strong increase.
