Figure 4.
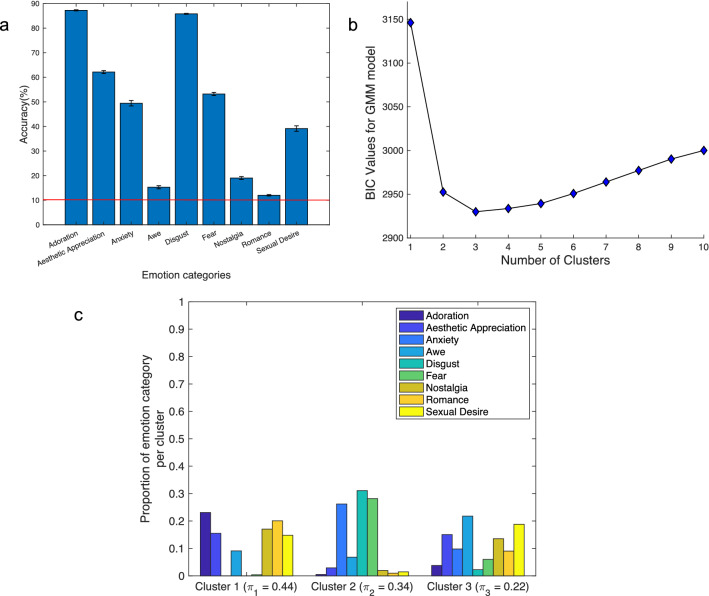
[Self-Report] Results from supervised and unsupervised analyses of self-report data. (a) Mean ± SEM classification accuracy for the most dominant six emotion category labels. The red line represents chance level accuracy (11.11%). (b) Plot of the BIC criterion used to discover the number of clusters in the GMM model. The x-axis represents the number of clusters to use and the y-axis represents the BIC value; the minimum value of BIC is the one chosen by the BIC criterion (here the minimum is 3 clusters). (c) Correspondence between clusters and the emotion category labels. Bars represent the proportion of trials from the dominant nine emotion categories within each discovered cluster. The total proportion of categories in each cluster sums to 1. The mixing proportion reported for each cluster is the probability that an observation comes from that cluster, which is representative of the size of the cluster.

