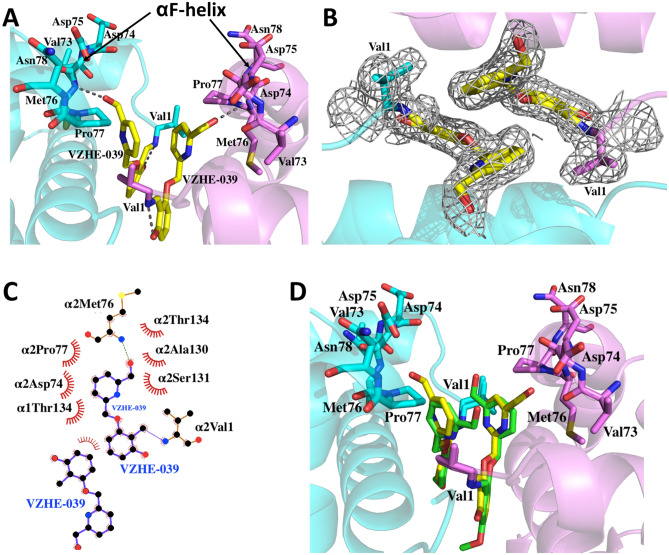
Figure 2.
Structure of Hb in the R2 conformation in complex with two molecules of VZHE-039 bound at the α-cleft. For clarity, not all binding site residues are shown, but described in the text. Hb subunits are shown as ribbons (α1 subunit in pink, α2 in cyan). (A) A pair of bound VZHE-039 (yellow sticks) at the α-cleft of Hb showing the close hydrogen-bond interaction with the nitrogen atom of Met76 of the αF-helix. (B) Final 2Fo-Fc electron density map of VZHE-039 (yellow stick) contoured at 1.0σ. (C) Two-dimensional contacts between one VZHE-039 molecule, the protein, and the second VZHE-039 molecule as described in the text. (D) Superposition of TD-7 (green) and VZHE-039 (yellow) molecules at the α-cleft of Hb. (A–D) were generated using the Pymol graphic software (The Pymol Molecular Graphics System, version 1.7.4, Schrödinger, LLC; https://pymol.org/2/support.html). (C) was generated with LIGPLOT: a program to generate schematic diagrams of protein–ligand interactions, version 2.2 (https://www.ebi.ac.uk/thornton-srv/software/LigPlus/)49.

