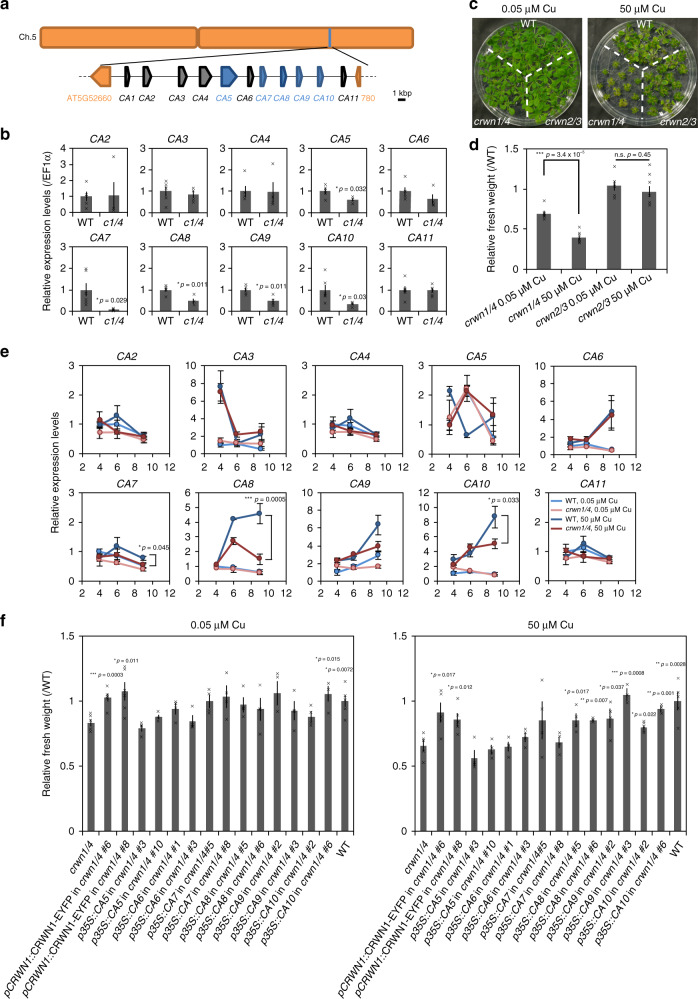
Fig. 4. CRWNs elevate expression of CA genes.
a Schematic figure of the CA gene locus on chromosome 5. Downregulated genes identified by qRT-PCR are shown in blue and other CA genes are shown in gray. b qRT-PCR analysis of CA genes in 2-week-old WT and crwn1crwn4 plants. Data were normalized to EF1α mRNA levels and are expressed as mean ± SEM relative to the WT value (defined as 1). Significance was determined using unpaired two-sided t-test (n = 5 individual experiments). Each data point represents a cross mark. c WT, crwn1crwn4, and crwn2crwn3 grown under normal and excess copper conditions for 2 weeks. d Fresh weight of 2-week-old WT, crwn1crwn4, and crwn2crwn3 grown under normal (n = 6 individual experiments) and excess copper conditions (n = 8 individual experiments). Fresh weights of crwn1crwn4 and crwn2crwn3 were normalized against that of WT to calculate relative fresh weight and are expressed as mean ± SEM. Significance was determined using unpaired two-sided t-test. Each data point represents a cross mark. e qRT-PCR analysis of CA gene transcript levels in 4-, 6-, and 9-day-old WT and crwn1crwn4 under normal and excess copper conditions. Data were normalized to EF1α mRNA levels and are expressed as mean ± SEM relative to the value of 4-day-old WT under normal condition (defined as 1). Significance was determined using unpaired two-sided t-test (n ≥ 3 individual experiments). f Fresh weight of 2-week-old WT, crwn1crwn4, and crwn1crwn4 expressing CRWN1-EYFP and CA genes under normal and excess copper conditions. Fresh weights of crwn1crwn4 and crwn1crwn4 expressing CRWN1-EYFP and CA genes were normalized against that of WT to calculate relative fresh weight and are expressed as mean ± SEM. Significance was determined using unpaired two-sided t-test (vs crwn1crwn4; n ≥ 3 individual experiments). Each data point represents a cross mark.

