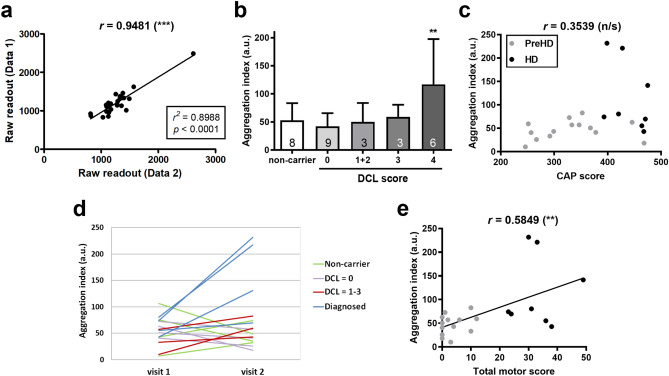
Figure 5.
High reproducibility of detecting disease-related mHTT seeding activities in CSF from living HD patients. (a) Identity blinded CSF samples from the PREDICT-HD collection were provided by BioSEND and applied to the mHTT-ΔN17-GFP cells at 1:20 dilution in the 384-well format for 5 days. Confocal images were acquired with automation and batch analyzed for aggregation scores. Upon unblinding the samples, the two aggregation readouts from the duplicated aliquots of the same CSF samples were plotted and showed high reproducibility between the duplicates of the samples using this assay. (b) The HD patients, mutation carriers and non-carrier controls were grouped based on their DCL scores. DCL1 and DCL2 are grouped together due to their small sample sizes. Numbers in the bars indicate the n of each group. (c) The correlation analysis of the CSF seeding activities and the CAP score. (d) The measured aggregation indices of both visits from the same individuals were plotted to visualize the change of CSF ceding activity. (e) The total motor scores was plotted against the CSF mHTT seeding activity to analyze their association. Pearson’s correlation coefficients (r) for (c) and (e) were calculated and noted on the top of the plots. Statistical significance (p value) of the correlation is shown in parentheses. Additional linear regression analyses were performed for (a,e), and shown in the squares. Bar graphs are presented as mean ± s.d. **p < 0.01; n/s = not significant.

