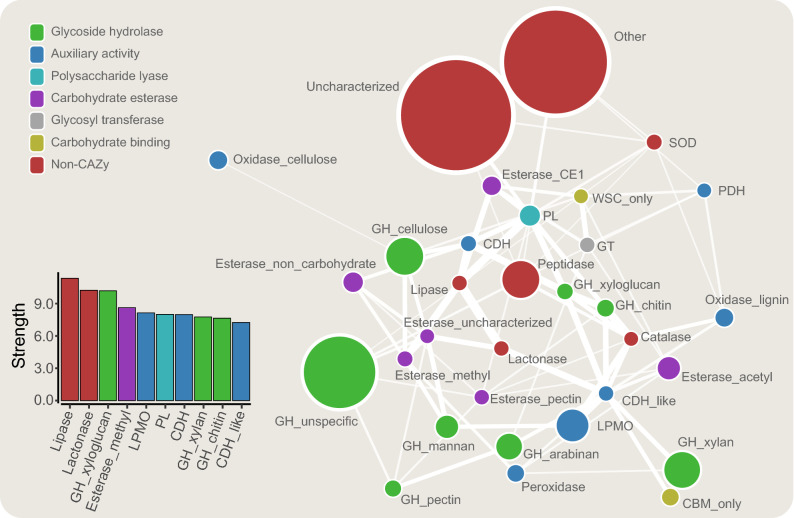
Figure 3.
Co-expression network. The figure shows a summarized interaction network of enzyme classes found in the five fungal secretomes. The size of the nodes reflects the number of proteins in each class, whereas the edges (lines) and their thickness reflect the degree of co-expression. The visualization was generated with a layout to reflect the node strength (spring-embedded), meaning that enzyme classes with high co-expression are close to one another. Note that while the network shows how likely enzymes from two classes are to be expressed (and secreted) together, it may overlook singular meaningful cooperation cases, e.g. a single enzyme expressed only on one specific substrate. Only significant edges are shown (marginal likelihood filter p < 0.05). For each node, we computed the sum of all the weighted edges connected to it (strength). The strength score (bottom left panel) reflects how much the enzymes from a certain class are expressed together with enzymes of other classes and is used for detection of hub classes. For enzyme class abbreviations, see text. The figure was made with R v3.6.1 and Cytoscape v3.7.1.

