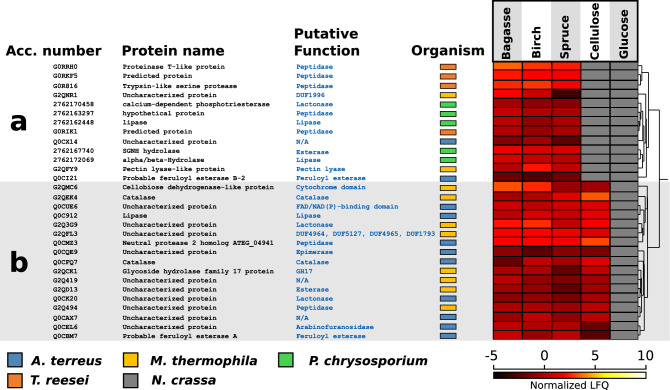
Figure 4.
Heat map representations of selected non-CAZy proteins. The figure shows the expression patterns of non-CAZy proteins that are predicted to be secreted and that are highly expressed when grown on (a) lignocellulose and (b) polysaccharides. Every row in the heat map represents a protein, and the colors represent the protein abundance (average of three replicates) when grown on five different substrates: sugarcane bagasse, birch, spruce, cellulose and glucose. The scale of the heat map ranges from high abundance (white color, normalized log2-based LFQ at 10) to low abundance (black color, normalized log2-based LFQ at − 5). The grey color indicates that the protein was not detected. Putative functions were assigned using Pfam and InterPro. Non-CAZy proteins with more diverse expression patterns, can be found in Figure S6. The figure was made with Perseus v1.6.0.7 and Inkscape v0.48.4 (https://inkscape.org/).

