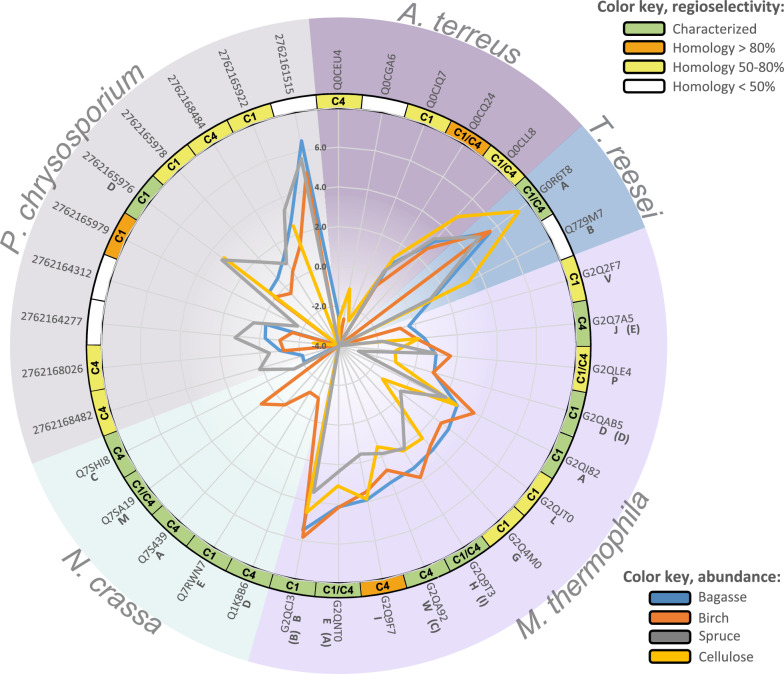
Figure 5.
LPMO expression profiles. The figure shows expression levels for all detected LPMOs for all five fungi grown on sugarcane bagasse, birch, spruce or cellulose. Glucose was left out as no LPMOs were expressed during growth on that substrate. The scale refers to log2-based and normalized LFQ values (the same as those shown in the heat maps of Figures S1–S5) and ranges from − 4.0 (center of circle) to 8.0. All LPMOs belong to the AA9 family, except for Q0CGA6 (A. terreus), which is an AA13. LPMOs that have previously been characterized (see text for references) are marked with green while LPMOs that share high sequence identity with characterized LPMOs are indicated by an orange (> 80%) or yellow (> 50%) color. For all LPMOs marked as previously characterized (green), activity on cellulose has been demonstrated. The known or predicted position of hydroxylation during oxidative cleavage is indicated as C1, C4 or C1/C4. LPMO letters are based on nomenclature from Berka et al.13 and Kadowaki et al.56 , while letters in brackets are from Frommhagen et al.81. The figure was made with Excel from Microsoft 365 (http://microsoft.com) and Inkscape v0.48.4 (https://inkscape.org/).

