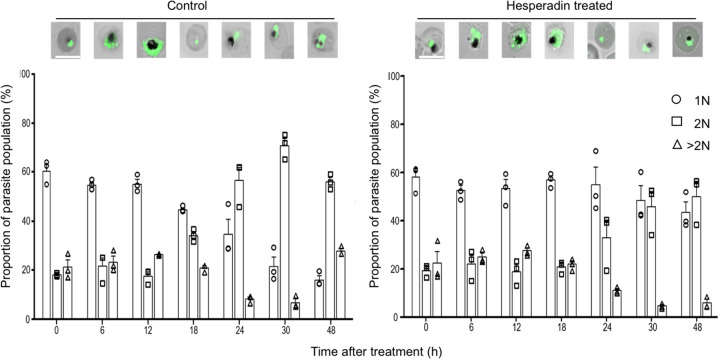
Fig. 3. Flow cytometry analysis of SYBR green staining material in asynchronous parasites untreated (control) or treated with Hesperadin.
Fluorescence microscopy of representative parasites from each time point is shown on top of the groups of bars. The relative ploidy of individual parasite counts included in each bar is shown on the legend to the right, assuming early rings are 1N (circles). Parasites with twice the DNA content (2N) are indicated by square symbols and counts of parasites with larger ploidy are indicated by triangles. Each symbol corresponds to an independent biological experiment and it is the average of three technical replicates. Bars are the average of the three experiments with the SEM.

