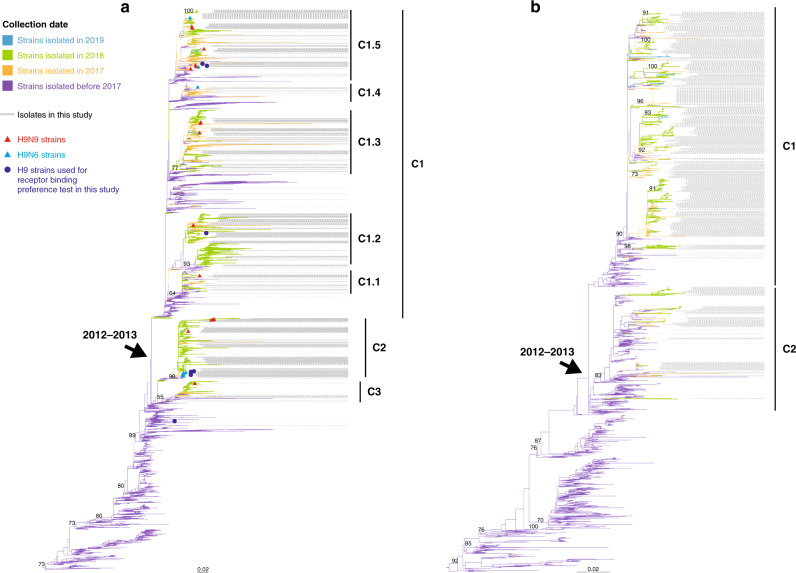
Fig. 3. Phylogenetic analysis of the HA gene of H9Ny AIVs and the NA gene of H9N2 AIVs.
a Phylogenetic tree of the HA gene of H9Ny AIVs. b Phylogenetic tree of the NA gene of H9N2 viruses. Viruses are marked with different colors according to the collection dates (before 2017: blue violet, in 2017: orange, in 2018: light green, and in 2019: light blue). Both trees are rooted using CK/BJ/1/1994(H9N2). The light blue and red triangles represent H9N6 and H9N9 viruses, respectively. All blue dots in the phylogenetic trees (a) represent H9N2 and H9N9 strains used for the receptor-binding test in this study. The labels with gray lines indicate all of the H9 isolates sequenced in this study.

