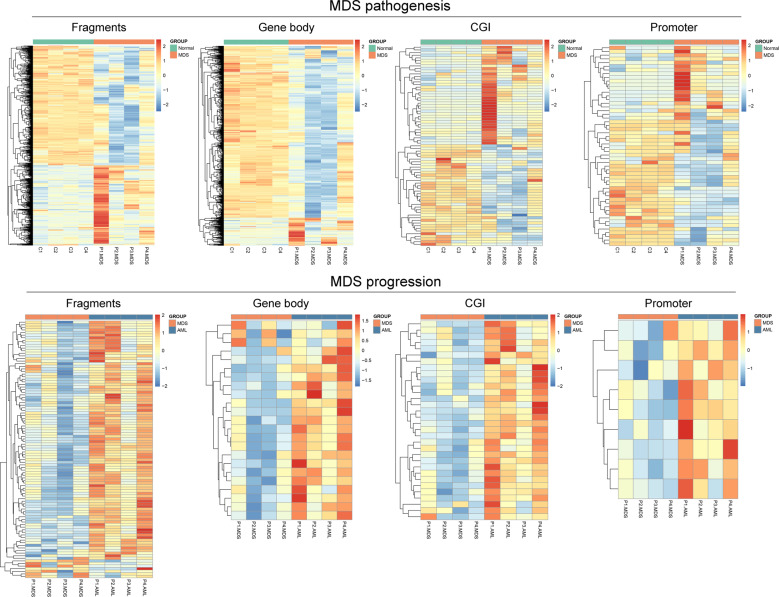
Fig. 2. Heatmaps summarizing differentially methylated fragments/genes analyzed by the unit of Mspl fragments, CpG islands, gene body, and promoter.
MDS pathogenesis indicated the difference compared between MDS and controls. MDS progression indicated the difference compared between sAML and MDS. The fragments/genes that passed statistical significance (paired/independent T test-P < 0.05, and also had >25% mean methylation difference) were considered as differentially methylated fragments/genes.

