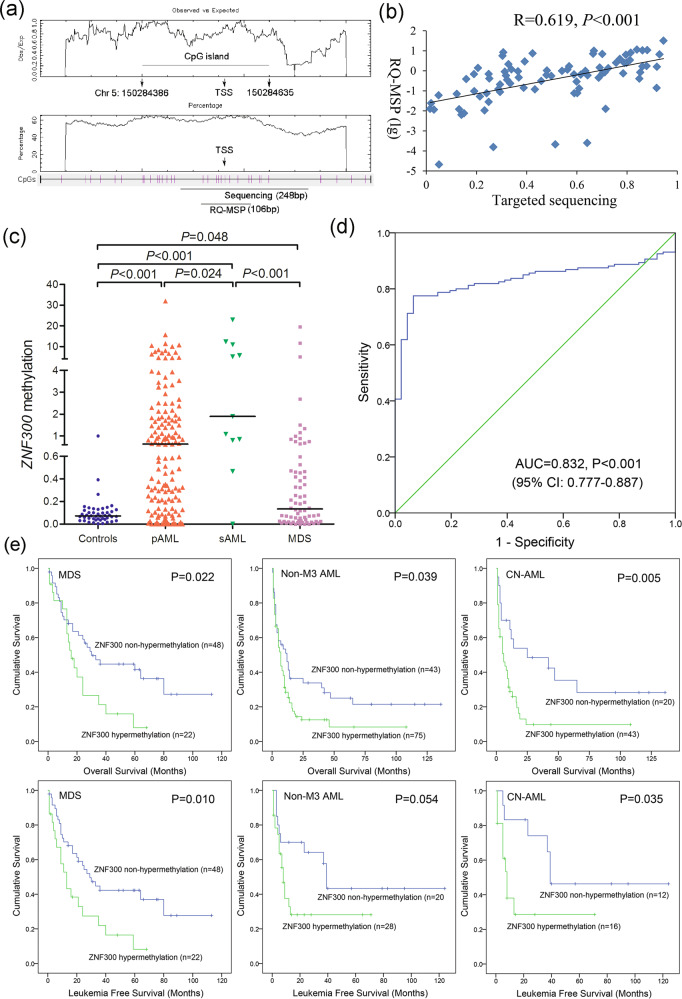
Fig. 7. Further confirmation of ZNF300 methylation in MDS and AML patients together with its prognostic value.
a The genomic coordinates of ZNF300 promoter region CpG island and primer locations. The panel plots the GC content as a percentage of the total. Each vertical bar in the bottom panel represents the presence of a CpG dinucleotide. Black horizontal bars indicate regions amplified by targeted bisulfite sequencing primer pairs and RQ-MSP primer pairs. This figure was created using CpGplot (http://emboss.bioinformatics.nl/cgi-bin/emboss/cpgplot) and Methyl Primer Express v1.0 software. TSS: transcription start site; RQ-MSP: real-time quantitative methylation-specific PCR. b The correlation of the candidate gene methylation results between the targeted bisulfite sequencing and RQ-MSP. The correlation was analyzed by Spearman correlation test. c The methylation level of the ZNF300 in larger samples of controls (n = 46), de novo MDS (n = 70) and AML patients (n = 170) analyzed by targeted bisulfite sequencing. P-values were calculated using the Mann–Whitney U-test. d ROC curve analysis using ZNF300 methylation for discriminating AML patients from controls. (e): The impact of ZNF300 methylation on leukemia-free survival and overall survival of MDS and AML patients. Survival was analyzed through Kaplan–Meier analysis using Log-rank test.

