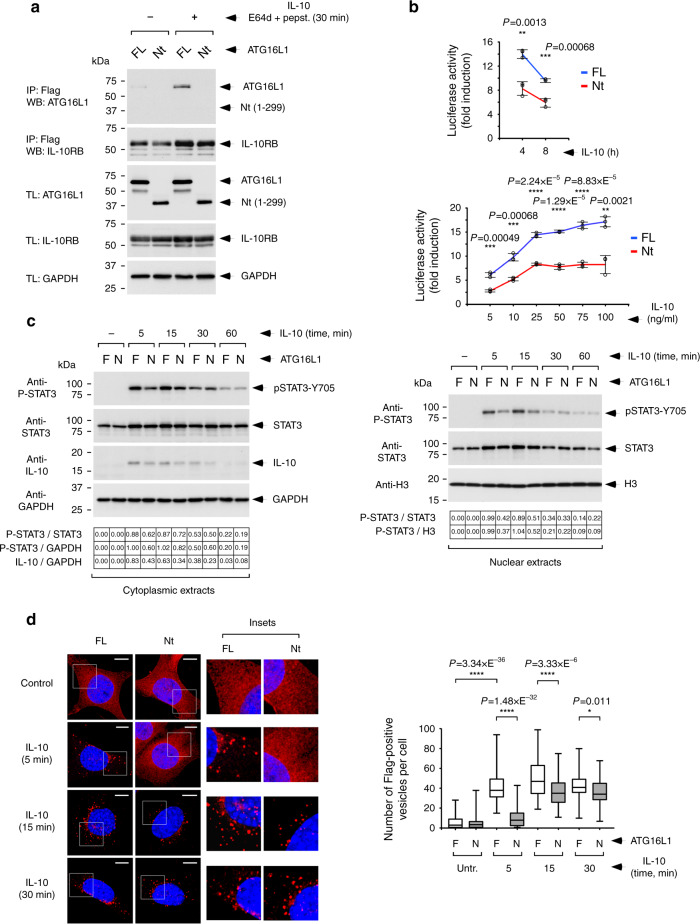
Fig. 4. Function of the WDD in IL-10R signaling examined in engineered MEFs.
Cells in all panels are Atg16L1−/− MEFs engineered to harbor a STAT3-luciferase reporter system and to express STAT3, subsequently restored with full-length ATG16L1 (FL) or a deleted version lacking the WDD (Nt, 1–299), and retrovirally transduced to express IL-10Rs A and B. a Co-precipitation between IL-10RB and ATG16L1 as a function of IL-10 treatment. The indicated cells (FL or Nt) were treated with IL-10 and E64d/pepstatin (10 μg/ml each) for 30 min or left untreated. Cells were then lysed and processed for anti-Flag immunoprecipitation. Shown are Western-blots against the indicated molecules. IP: immunoprecipitate; TL: total lysate. b Time-course and dose-response activation of STAT3-luciferase activity by IL-10. The indicated cells (FL or Nt) were treated with IL-10 for the shown times (100 ng/ml; top panel) or with the indicated doses of IL-10 (4 h; bottom panel), and lysed to measure luciferase activity. Data are expressed as the mean of fold induction of luciferase activity −/+ s.d of triplicate experimental points (n = 3; **P < 0.01; ***P < 0.001; ****P < 0.0001, two-sided Student’s t-test) from a representative experiment. c Pulse-chase assay of IL-10-induced STAT3 phosphorylation. Cells (F: FL, N: Nt) were pre-incubated with IL-10 (50 ng/ml; 30 min on ice), incubated at 37 °C for the shown times and lysed to obtain cytoplasmic and nuclear extracts for Western-blotting against the indicated molecules (H3, Histone-3). Corrected densitometric quantifications are shown at the bottom of the Western-blot images. d Immunofluorescence assay to evaluate the number of Flag-positive intracellular vesicles in IL-10 treated cells. The indicated cells were incubated with IL-10 (50 ng/ml) for the shown times and processed for anti-Flag immunofluorescence. Shown are representative confocal pictures (left). The graph (right) displays the number of Flag-positive vesicles per cell in the different conditions. Data are presented as box-plots where the central line represents the median value, the box shows percentiles 25–75 and the whiskers include the most extreme values (n = 56, n = 68 cells for untreated and treated samples, respectively; *P < 0.05; ****P < 0.0001, two-sided Student’s t-test).

