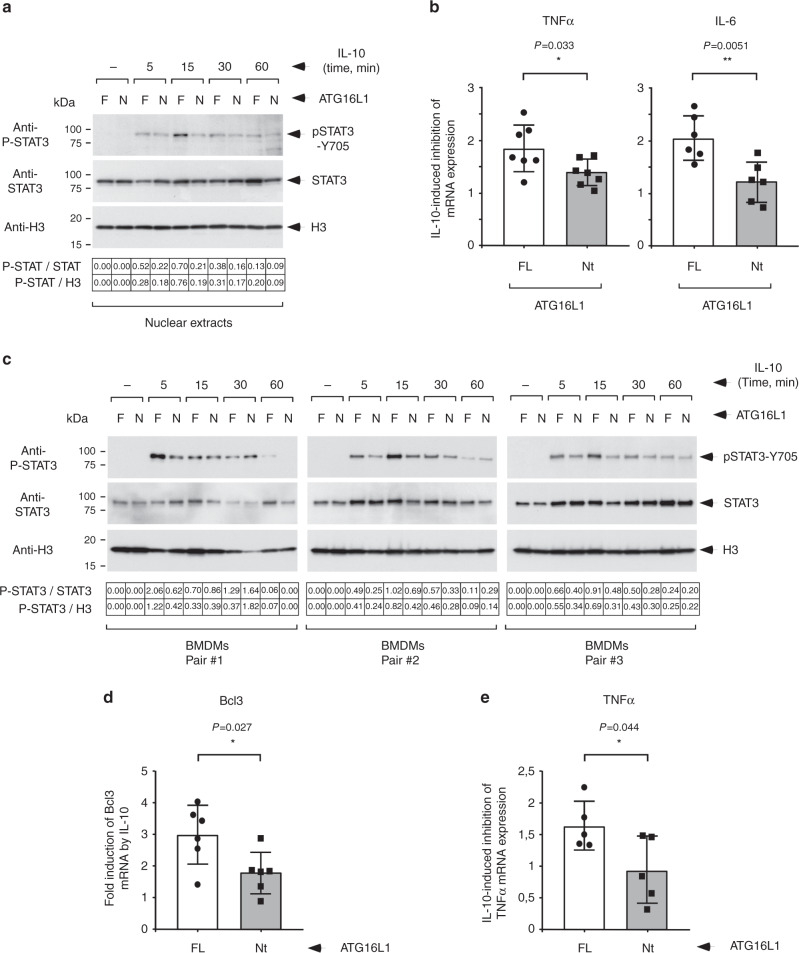
Fig. 6. Function of the WDD in IL-10 signaling in THP1 cells and BMDMs.
a Pulse-chase assay of IL-10-induced STAT3 phosphorylation in differentiated THP1 cells. The indicated strains (F: endogenous full-length ATG16L1; N: CRISPR/Cas9-induced ATG16L1 depletion (guide 1025–1044) plus restoration with the Nt domain, aminoacids 1–299) were treated with PMA (125 ng/ml; 48 h), pre-incubated with IL-10 (50 ng/ml; 30 min on ice), incubated at 37 °C for the shown times and lysed to obtain nuclear extracts for the indicated Western-blots. Corrected densitometric quantifications are shown at the bottom of the Western-blot images. b Quantitative PCR to assess IL-10-induced suppression of TNF and IL-6 mRNA upregulation by LPS in THP1 cells. Cells were pre-activated as in a, treated with LPS (TNF, 10 ng/ml; IL-6, 10 or 60 ng/ml) for 5 h with or without IL-10 (50 ng/ml) and lysed for qPCR. Shown are average fold inhibition values induced by IL-10 −/+ s.d. (TNF: n = 7, IL-6: n = 6 experimental points; *P < 0.05; **P < 0.01, two-sided Student’s t-test). c Pulse-chase assay of IL-10-induced STAT3 phosphorylation in BMDMs. BMDMs from 3 randomly-chosen mouse pairs (F: full-length ATG16L1; N: E230 mice expressing the Nt domain) were pre-incubated with IL-10 (50 ng/ml; 30 min on ice), incubated at 37 °C for the shown times and lysed to obtain nuclear extracts for the indicated Western-blots. Corrected densitometric quantifications are shown at the bottom of the Western-blot images. A statistical analysis of nuclear P-STAT3 signals is shown in Supplementary Fig. 16c. d Quantitative PCR to evaluate IL-10-induced expression of Bcl3. BMDMs from the indicated mice were treated with IL-10 (50 ng/ml, 4 h) and lysed for qPCR. Shown are average fold induction values induced by IL-10 −/+ s.d. (n = 6 mice; *P < 0.05, two-sided Student’s t-test). e Quantitative PCR to assess IL-10-induced suppression of TNF mRNA upregulation by LPS. BMDMs from the indicated mice were treated with LPS (1 ng/ml; 6 h) with or without IL-10 (50 ng/ml) and lysed for qPCR. Shown are average fold inhibition values induced by IL-10 −/+ s.d. (n = 5 mice; *P < 0.05, two-sided Student’s t-test).

