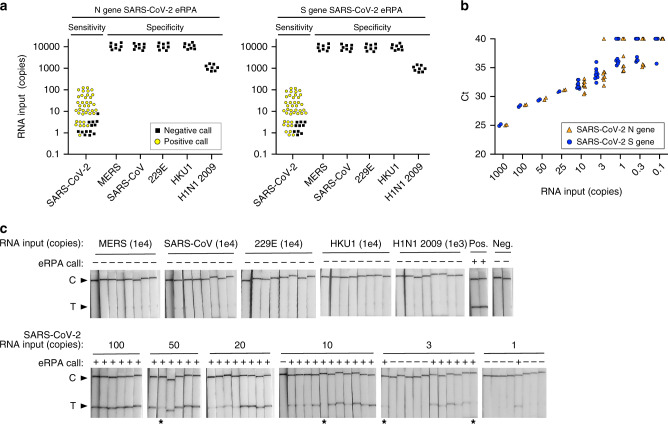
Fig. 2. Sensitivity and specificity of RNA detection.
a Summary of eRPA test results for detection of RNA from SARS-CoV-2 or from other viruses. Synthetic full genome SARS-CoV-2 RNA was amplified by eRPA using primers targeting the N or S gene and reactions were read out by lateral flow strip. The specificity of eRPA was tested against either in vitro transcribed (IVT) RNA of the related viruses MERS and SARS-CoV, or IVT RNA of the common cold coronaviruses HCoV-HKU1 and HCoV-229E, or viral genomic RNA extracted from 2009 H1N1 Influenza. Data points represent positive (yellow circles) or negative (black squares) eRPA tests for each sample tested and are staggered on both axes for visualization. b Quantification of the synthetic full genome SARS-CoV-2 RNA used as input in the eRPA assay by RT-qPCR. Data are Ct values determined using a one-step commercial RT-qPCR assay using primers targeting either the N or S gene of SARS-CoV-2. Data points at Ct = 40 represent non-specific or no amplification. N gene (orange triangles) and S gene (blue circles) data are offset on the x-axis for visualization purposes. c Lateral flow strip readouts for all N gene data shown in a. Individual strips are labeled with the test call made within 20 min of detection (positive (+) or negative (−)). The positive (Pos.) eRPA control is 1000 copies of synthetic full genome SARS-CoV-2 RNA and the negative (Neg.) eRPA control is a water-only input. Images taken for the purpose of display were allowed to dry which reduced the intensity of some weak bands (labeled with asterisks). Source data are available in the Source Data file.

